In part one, we briefly looked at the history of devtools and how its emergence greatly improved developer experience when creating web apps. We also looked at a high-level summary of the core capabilities devtools provide. Lastly, we familiarised ourselves with the DevTools panel outlining what information we might find in each panel section.
In part two of our series, we'll dive into one of the core functionalities of DevTools: Edit. With Edit, we can interact directly with the DOM and inspect and make observable changes to HTML, CSS and JS. We'll explore some of the common modifications made to the DOM, including changing node types, deleting or adding new nodes and amending CSS stylings.
Inspecting DOM nodes
This is perhaps the most commonly used purpose for devtools. You can inspect DOM nodes, manipulate the DOM and see changes in real-time. A convenient feature for playing around with the structure and style of page content without going into the source HTML code.
Before we look at how we can edit the DOM, let's first clarify what it means to edit it and how this differs from editing the HTML.
A server returns an HTML document when you visit a site and make a page request (image 1). The browser then parses this and generates a tree of objects representing the page's content: the DOM (image 2).
Image 1: Page source shows HTML 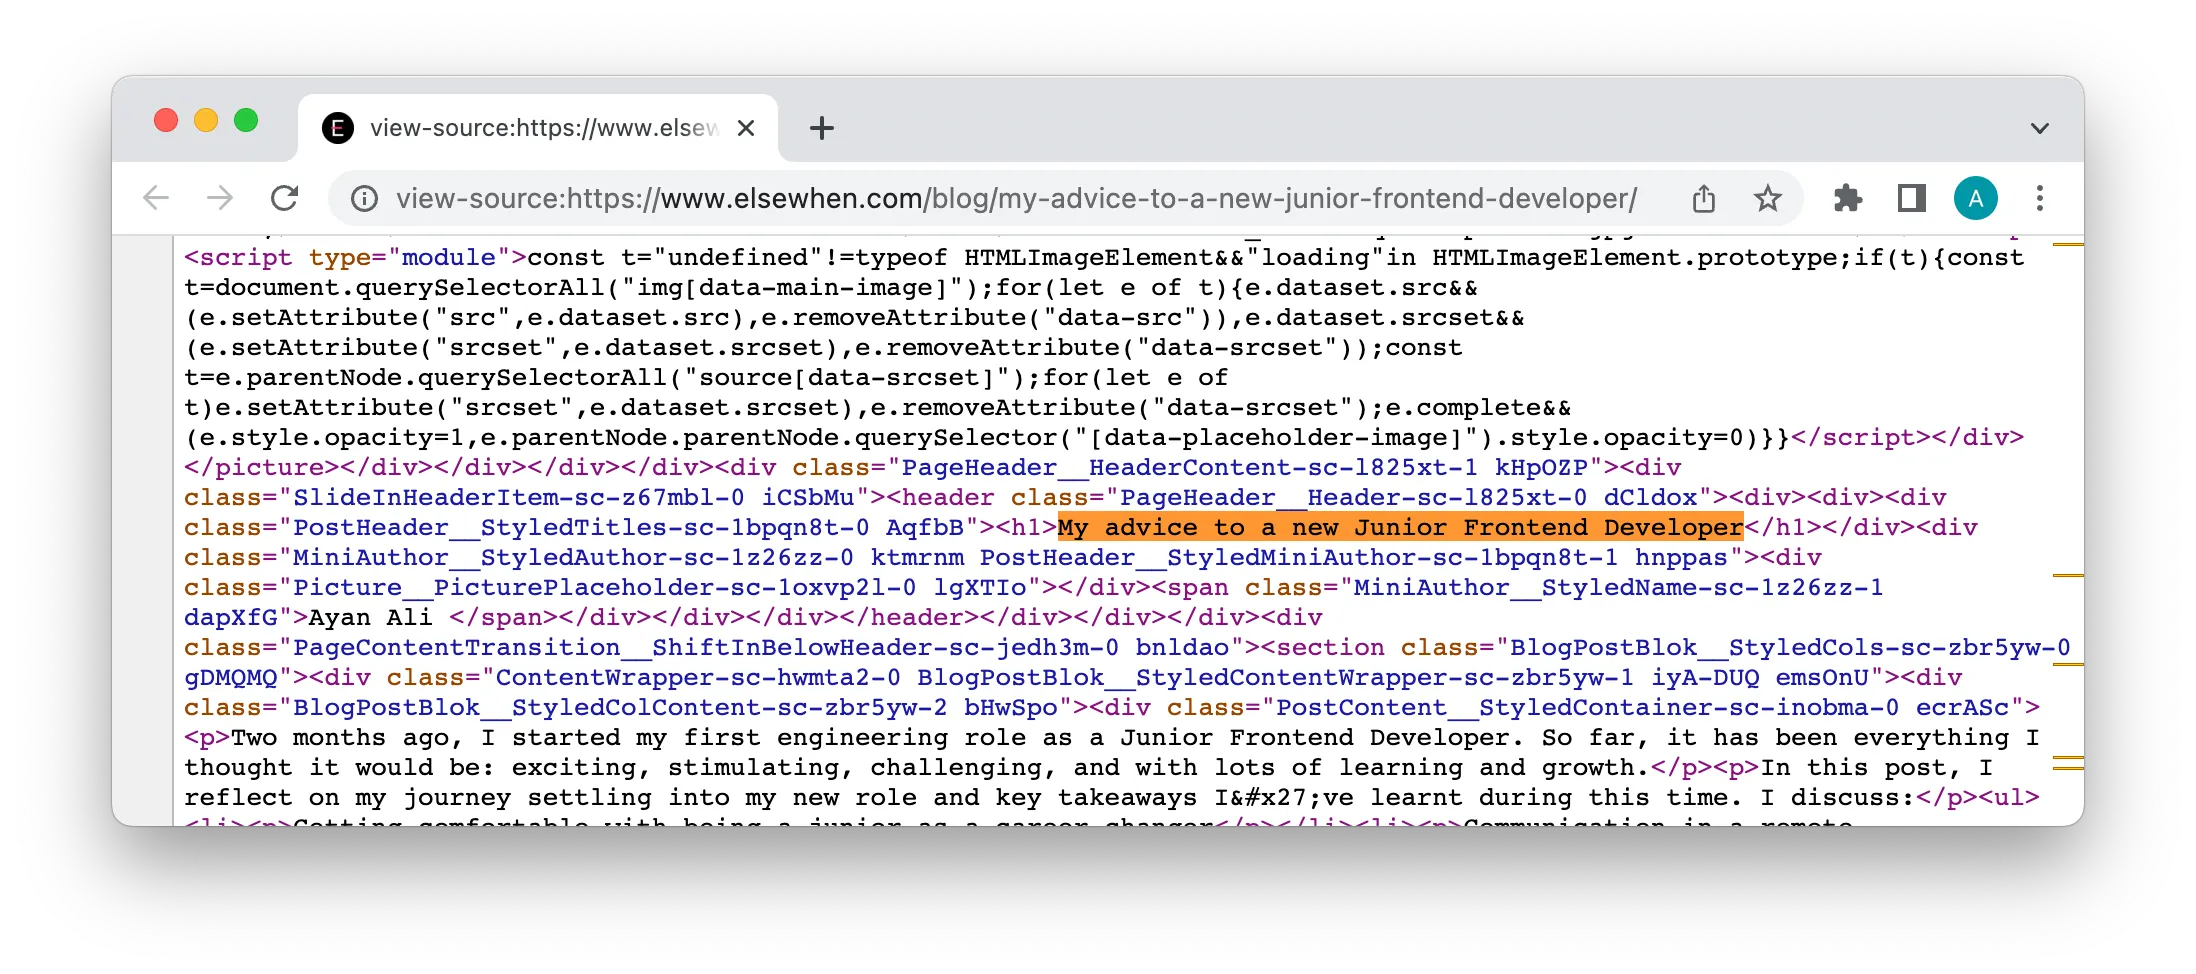
Image 2: DOM representation of HTML 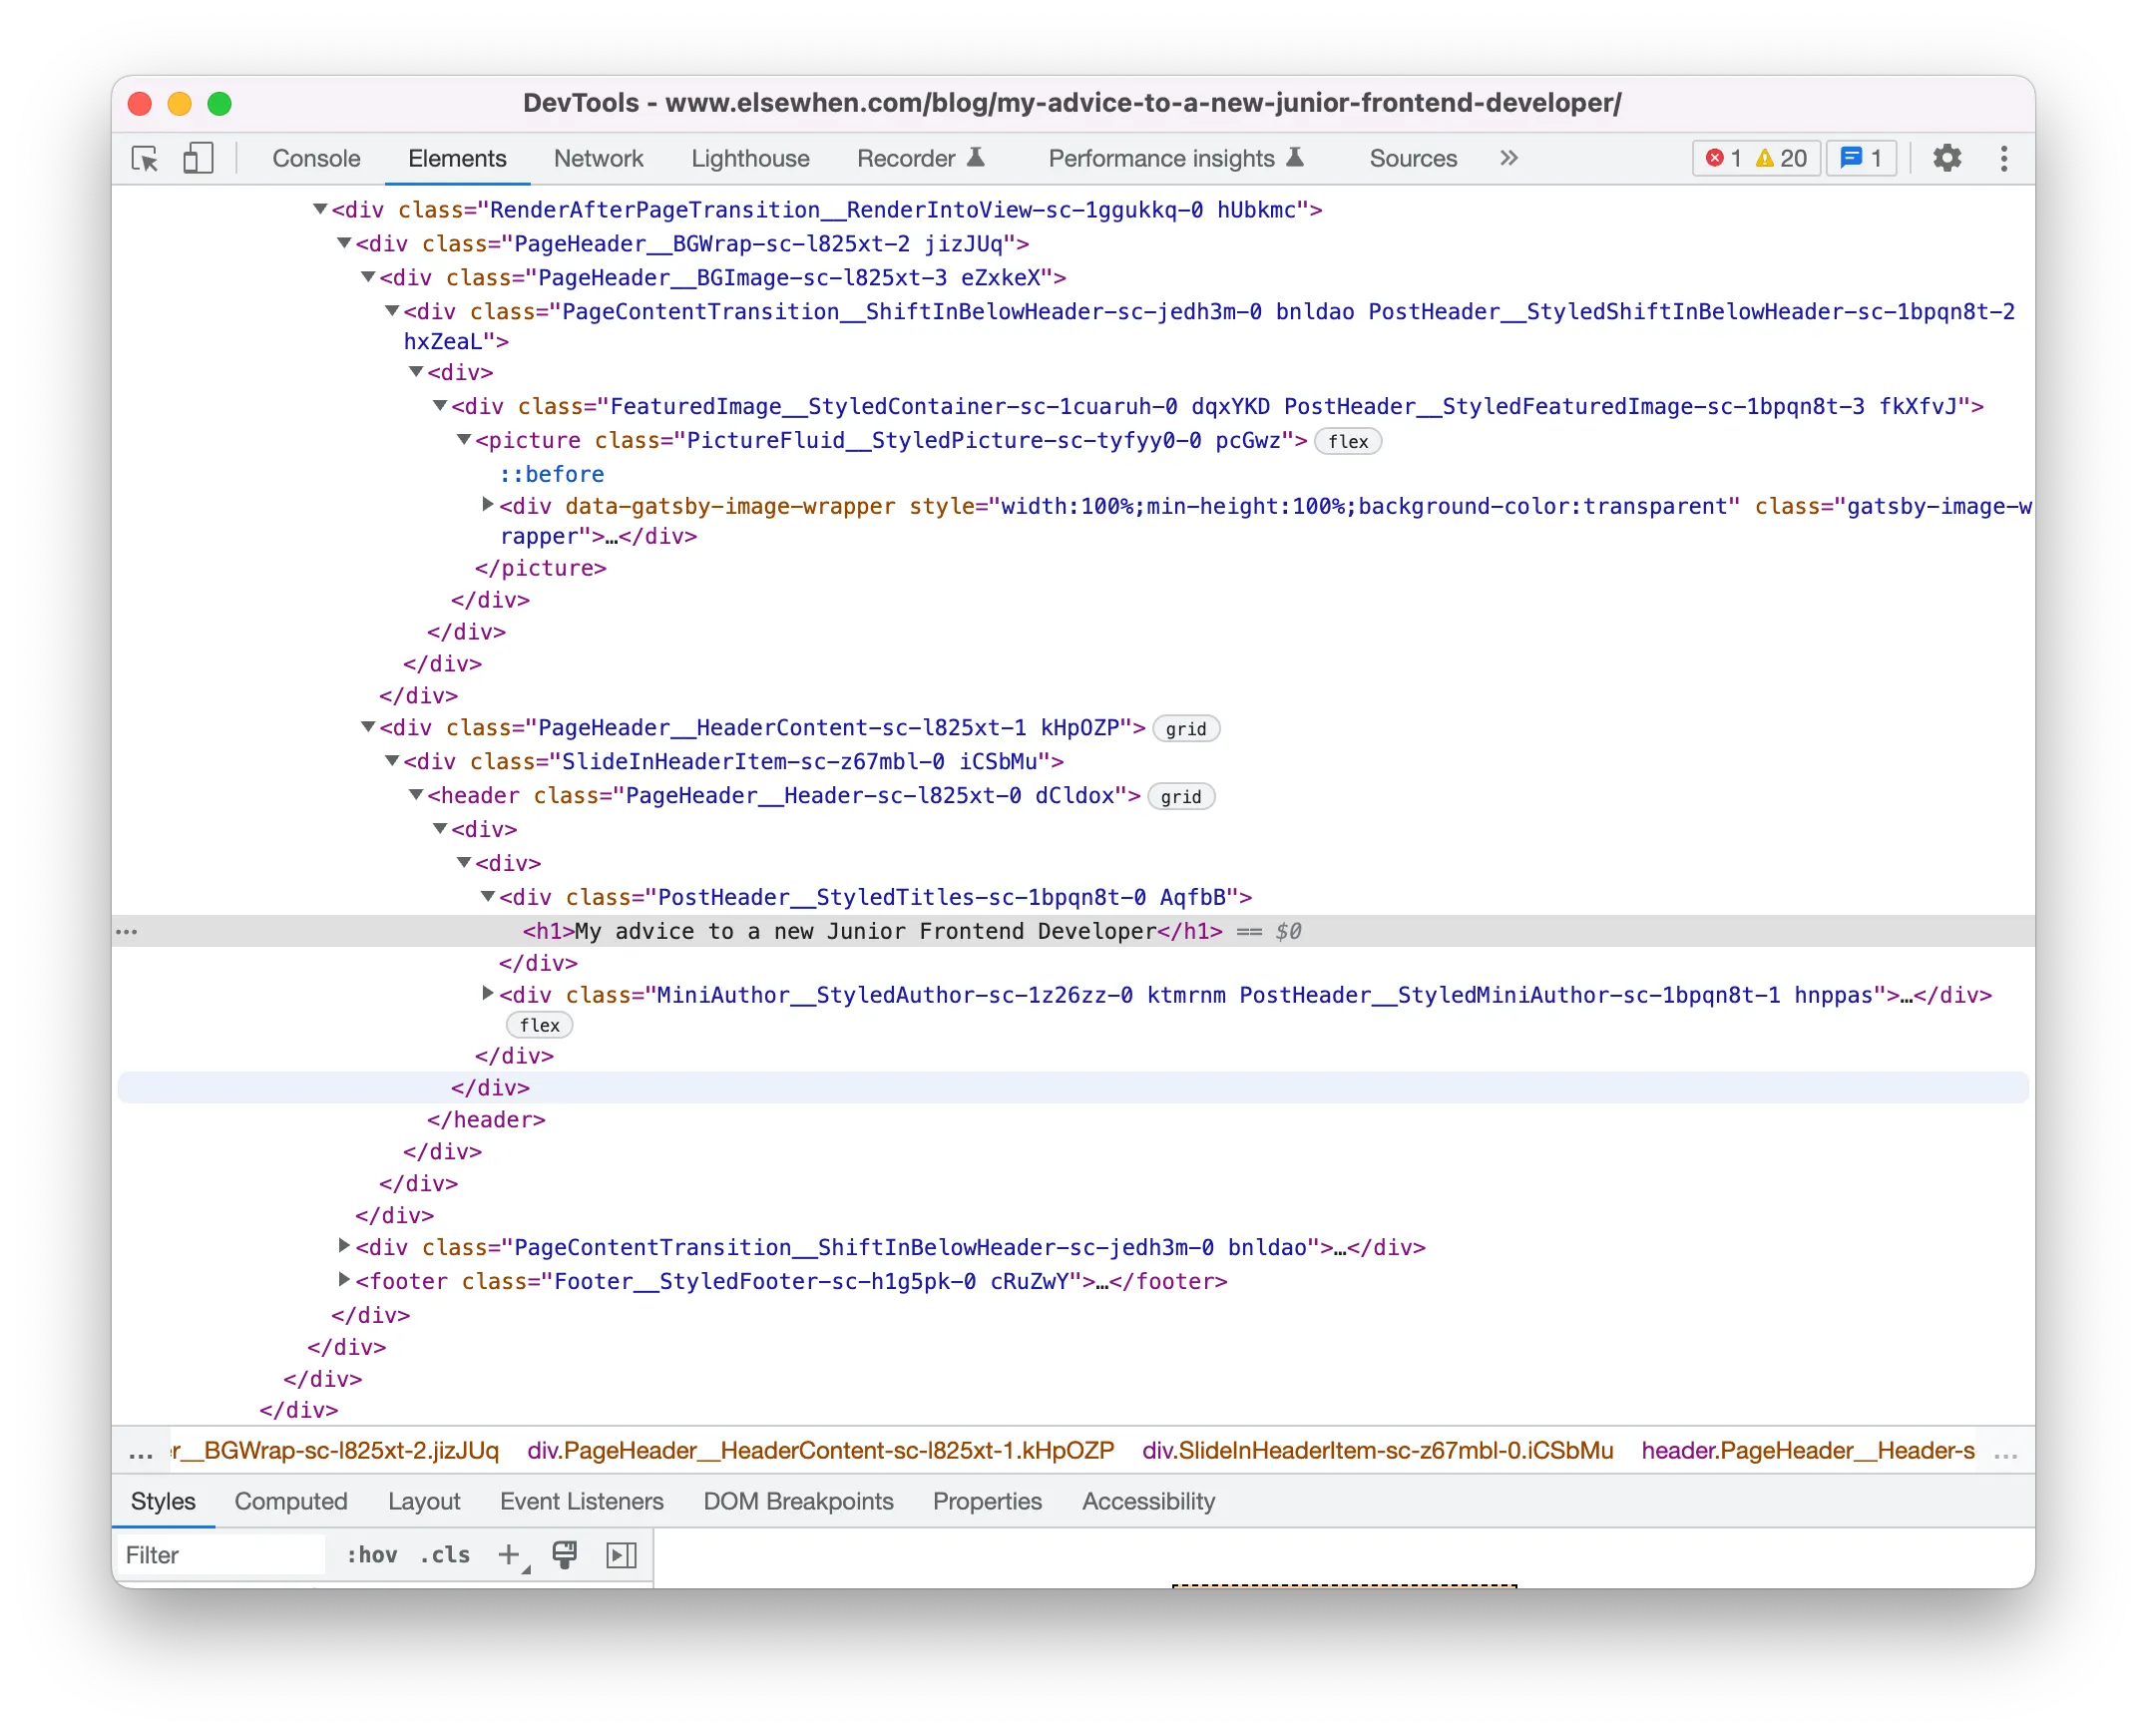
How is the DOM different from the initial HTML?
In the examples above, both the HTML and DOM look identical. We can find the same h1 title element in both the HTML and DOM. However, if a JS script in the HTML amends an element on the page following some interaction, the updated DOM will reflect the script's changes and look different from the initial HTML. This mechanism is facilitated by the DOM's visual tree-like hierarchy of the original HTML elements ending in nodes. Each node contains an object which can be manipulated and interacted with via DOM methods.
Ways to edit the DOM
Now that we have access to the DOM, let's look at some of the ways we can edit it in the following simple shopping list app.
To explore devtools functionalities, let's play around with the following simple shopping list application built on codepen. The functionalities of the application are straightforward. We can:
Add an item to a list by clicking the submit button
Cross out an item from the list by clicking on the list item
Remove an item from the list by double clicking on the item
Modify node types
Almost everything on a DOM node can be edited. This includes content, node type, and even reordering nodes. Let's look at a few examples for each of the above.
The app allows us to add items to a shopping list and remove them. Currently, items are added to an ordered list. If we want to compare this to an unordered list visually, we can do this by editing the DOM element as follows.
Right click and select inspect
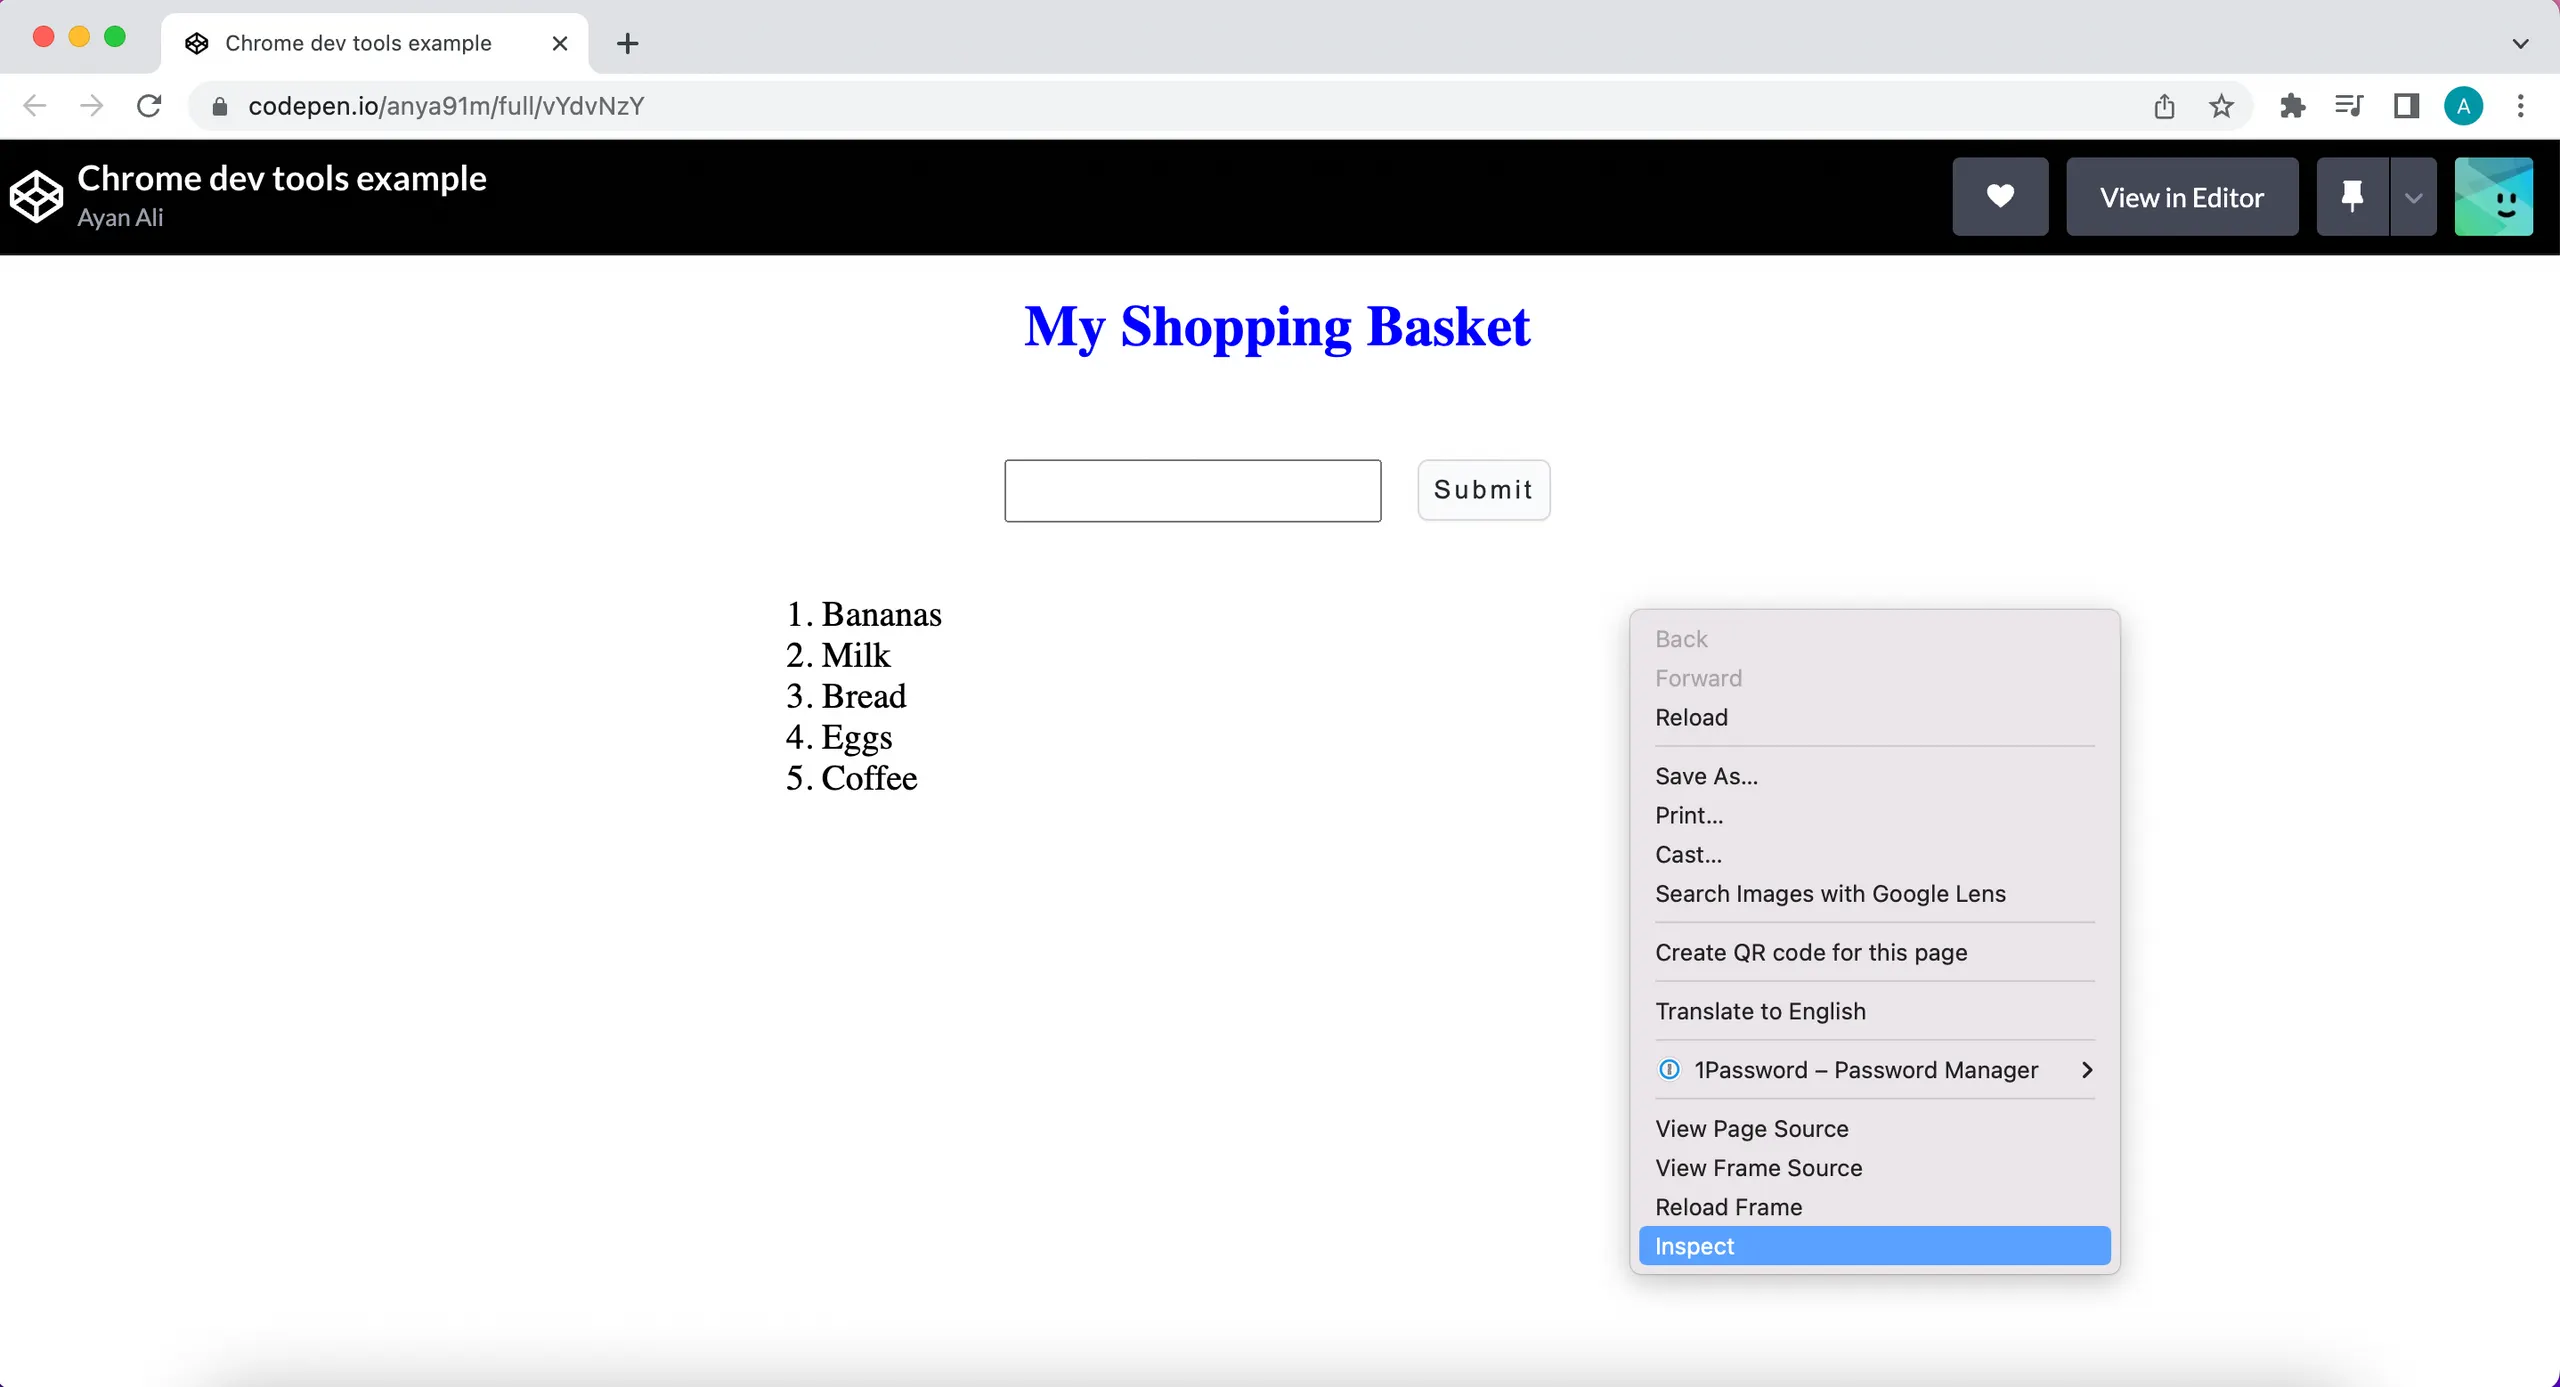
Navigate to the
<ol>element via the element selection inspector circled in yellow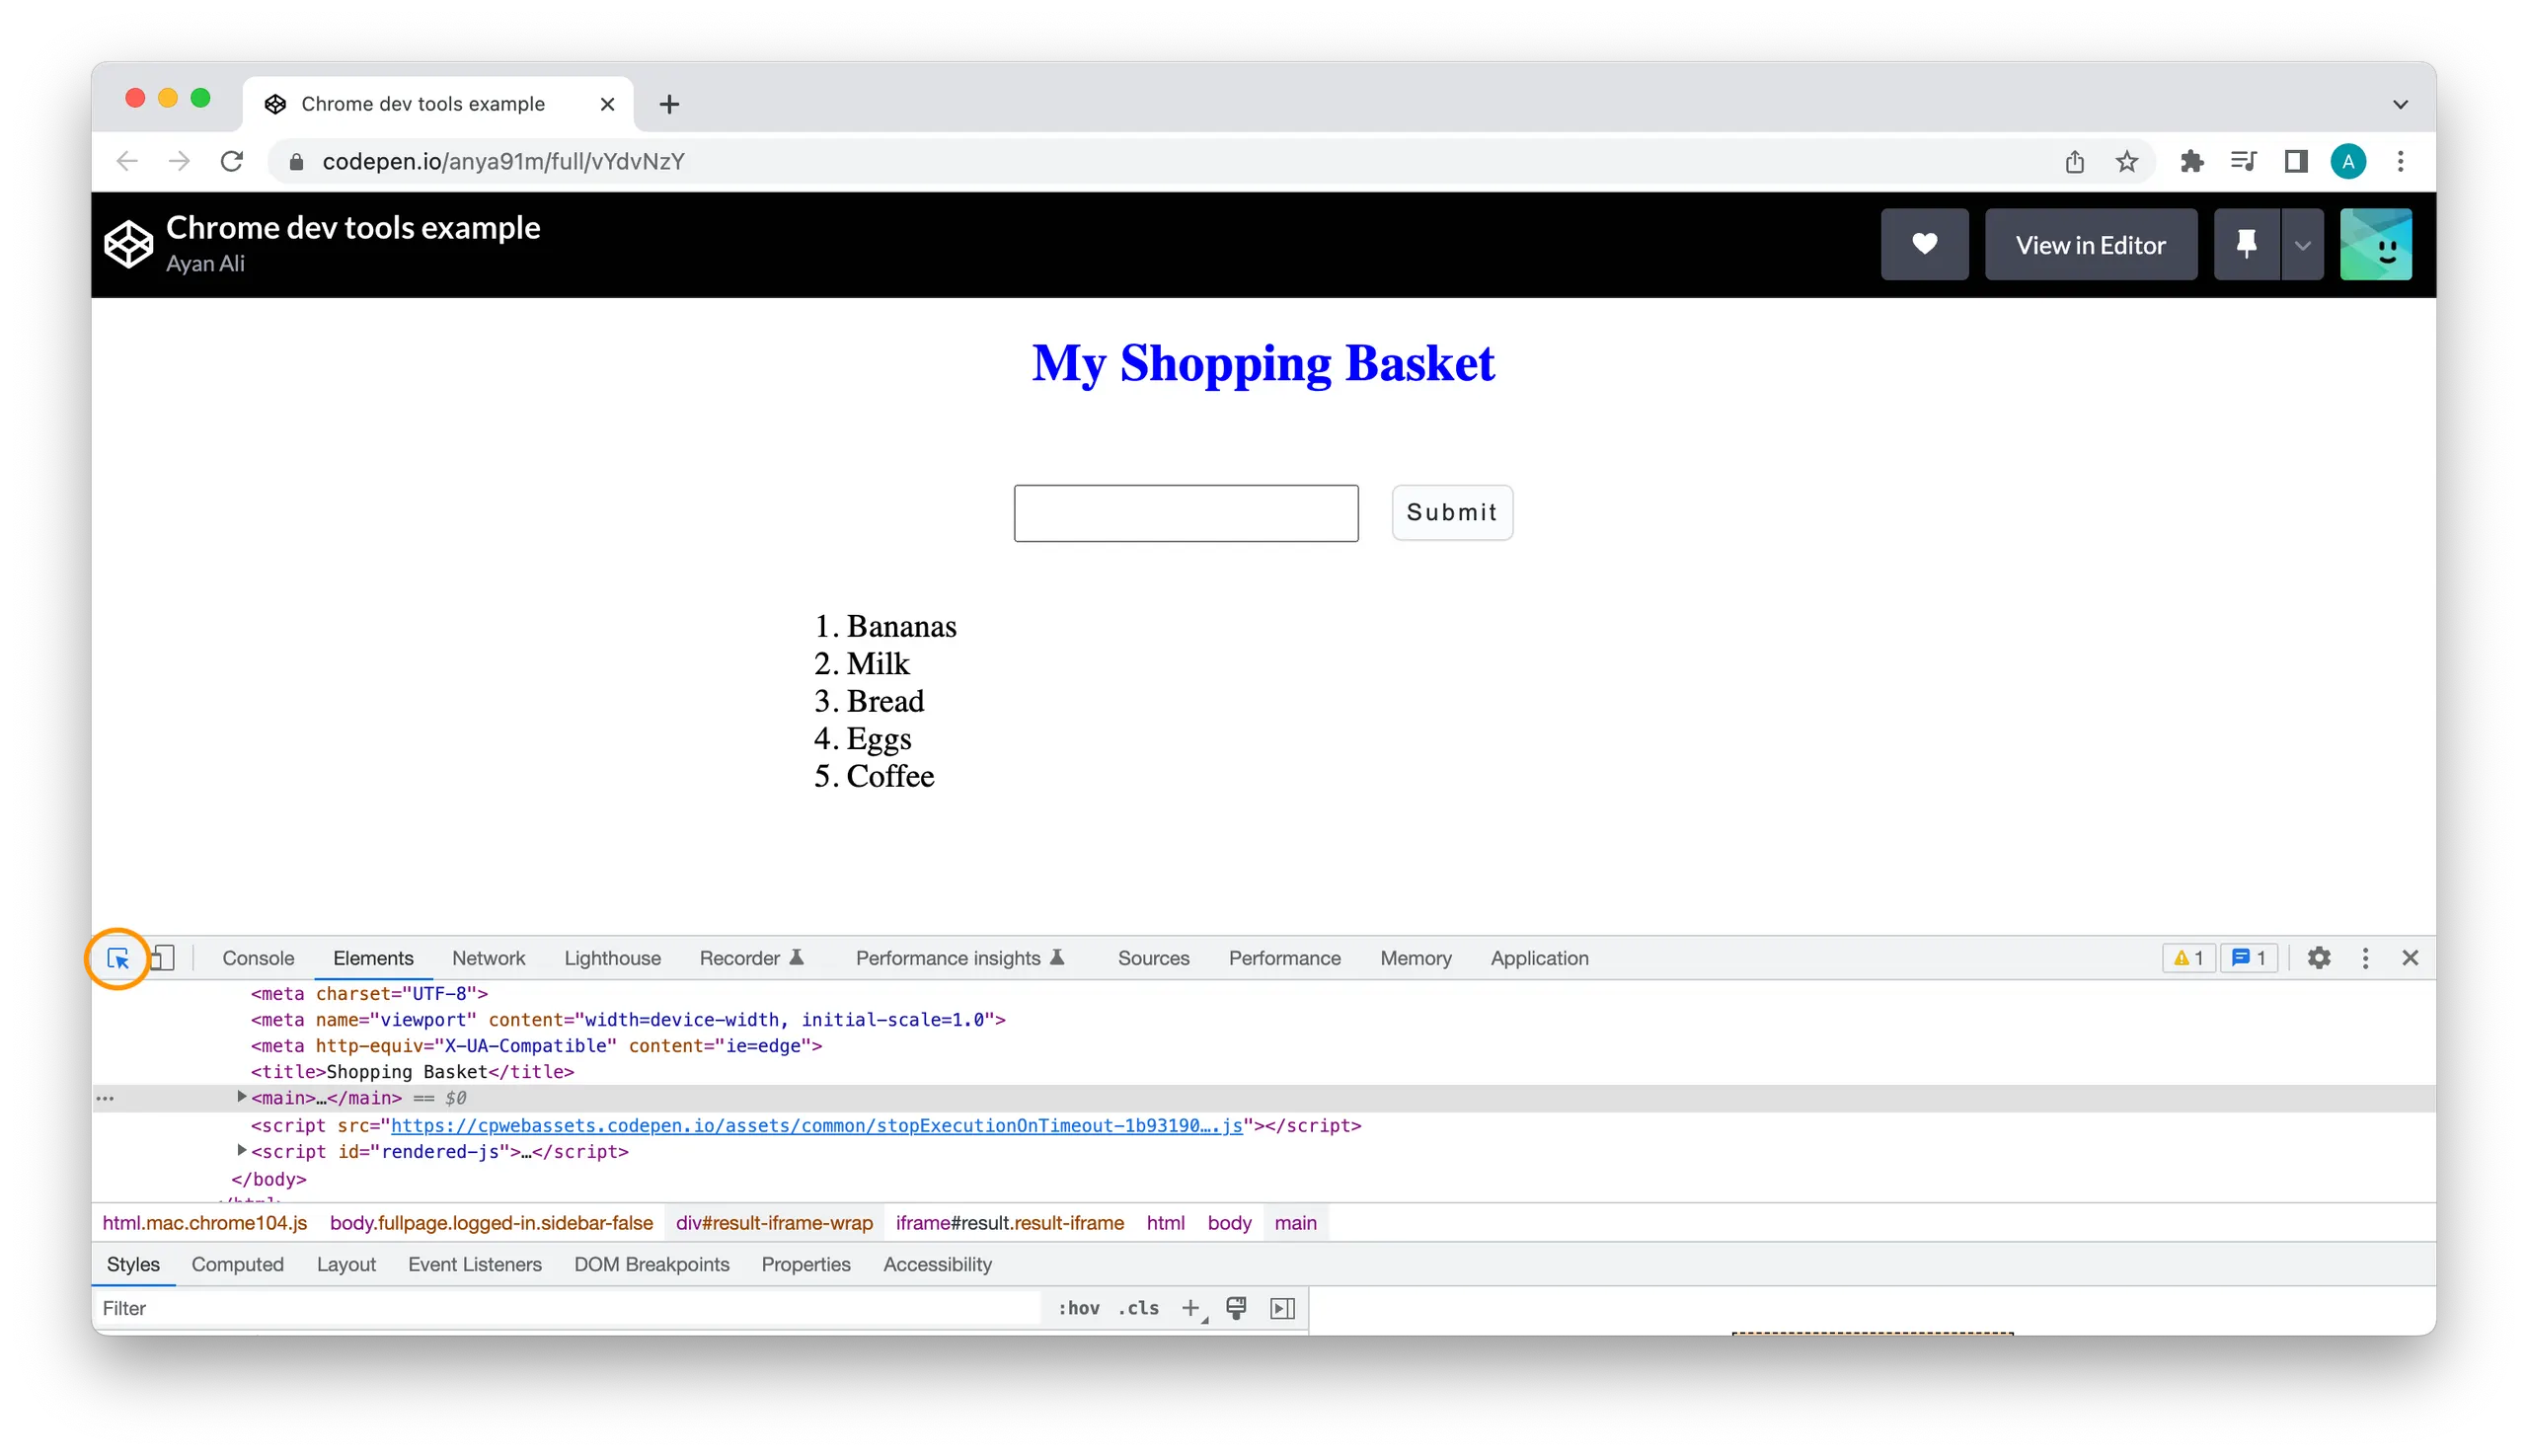
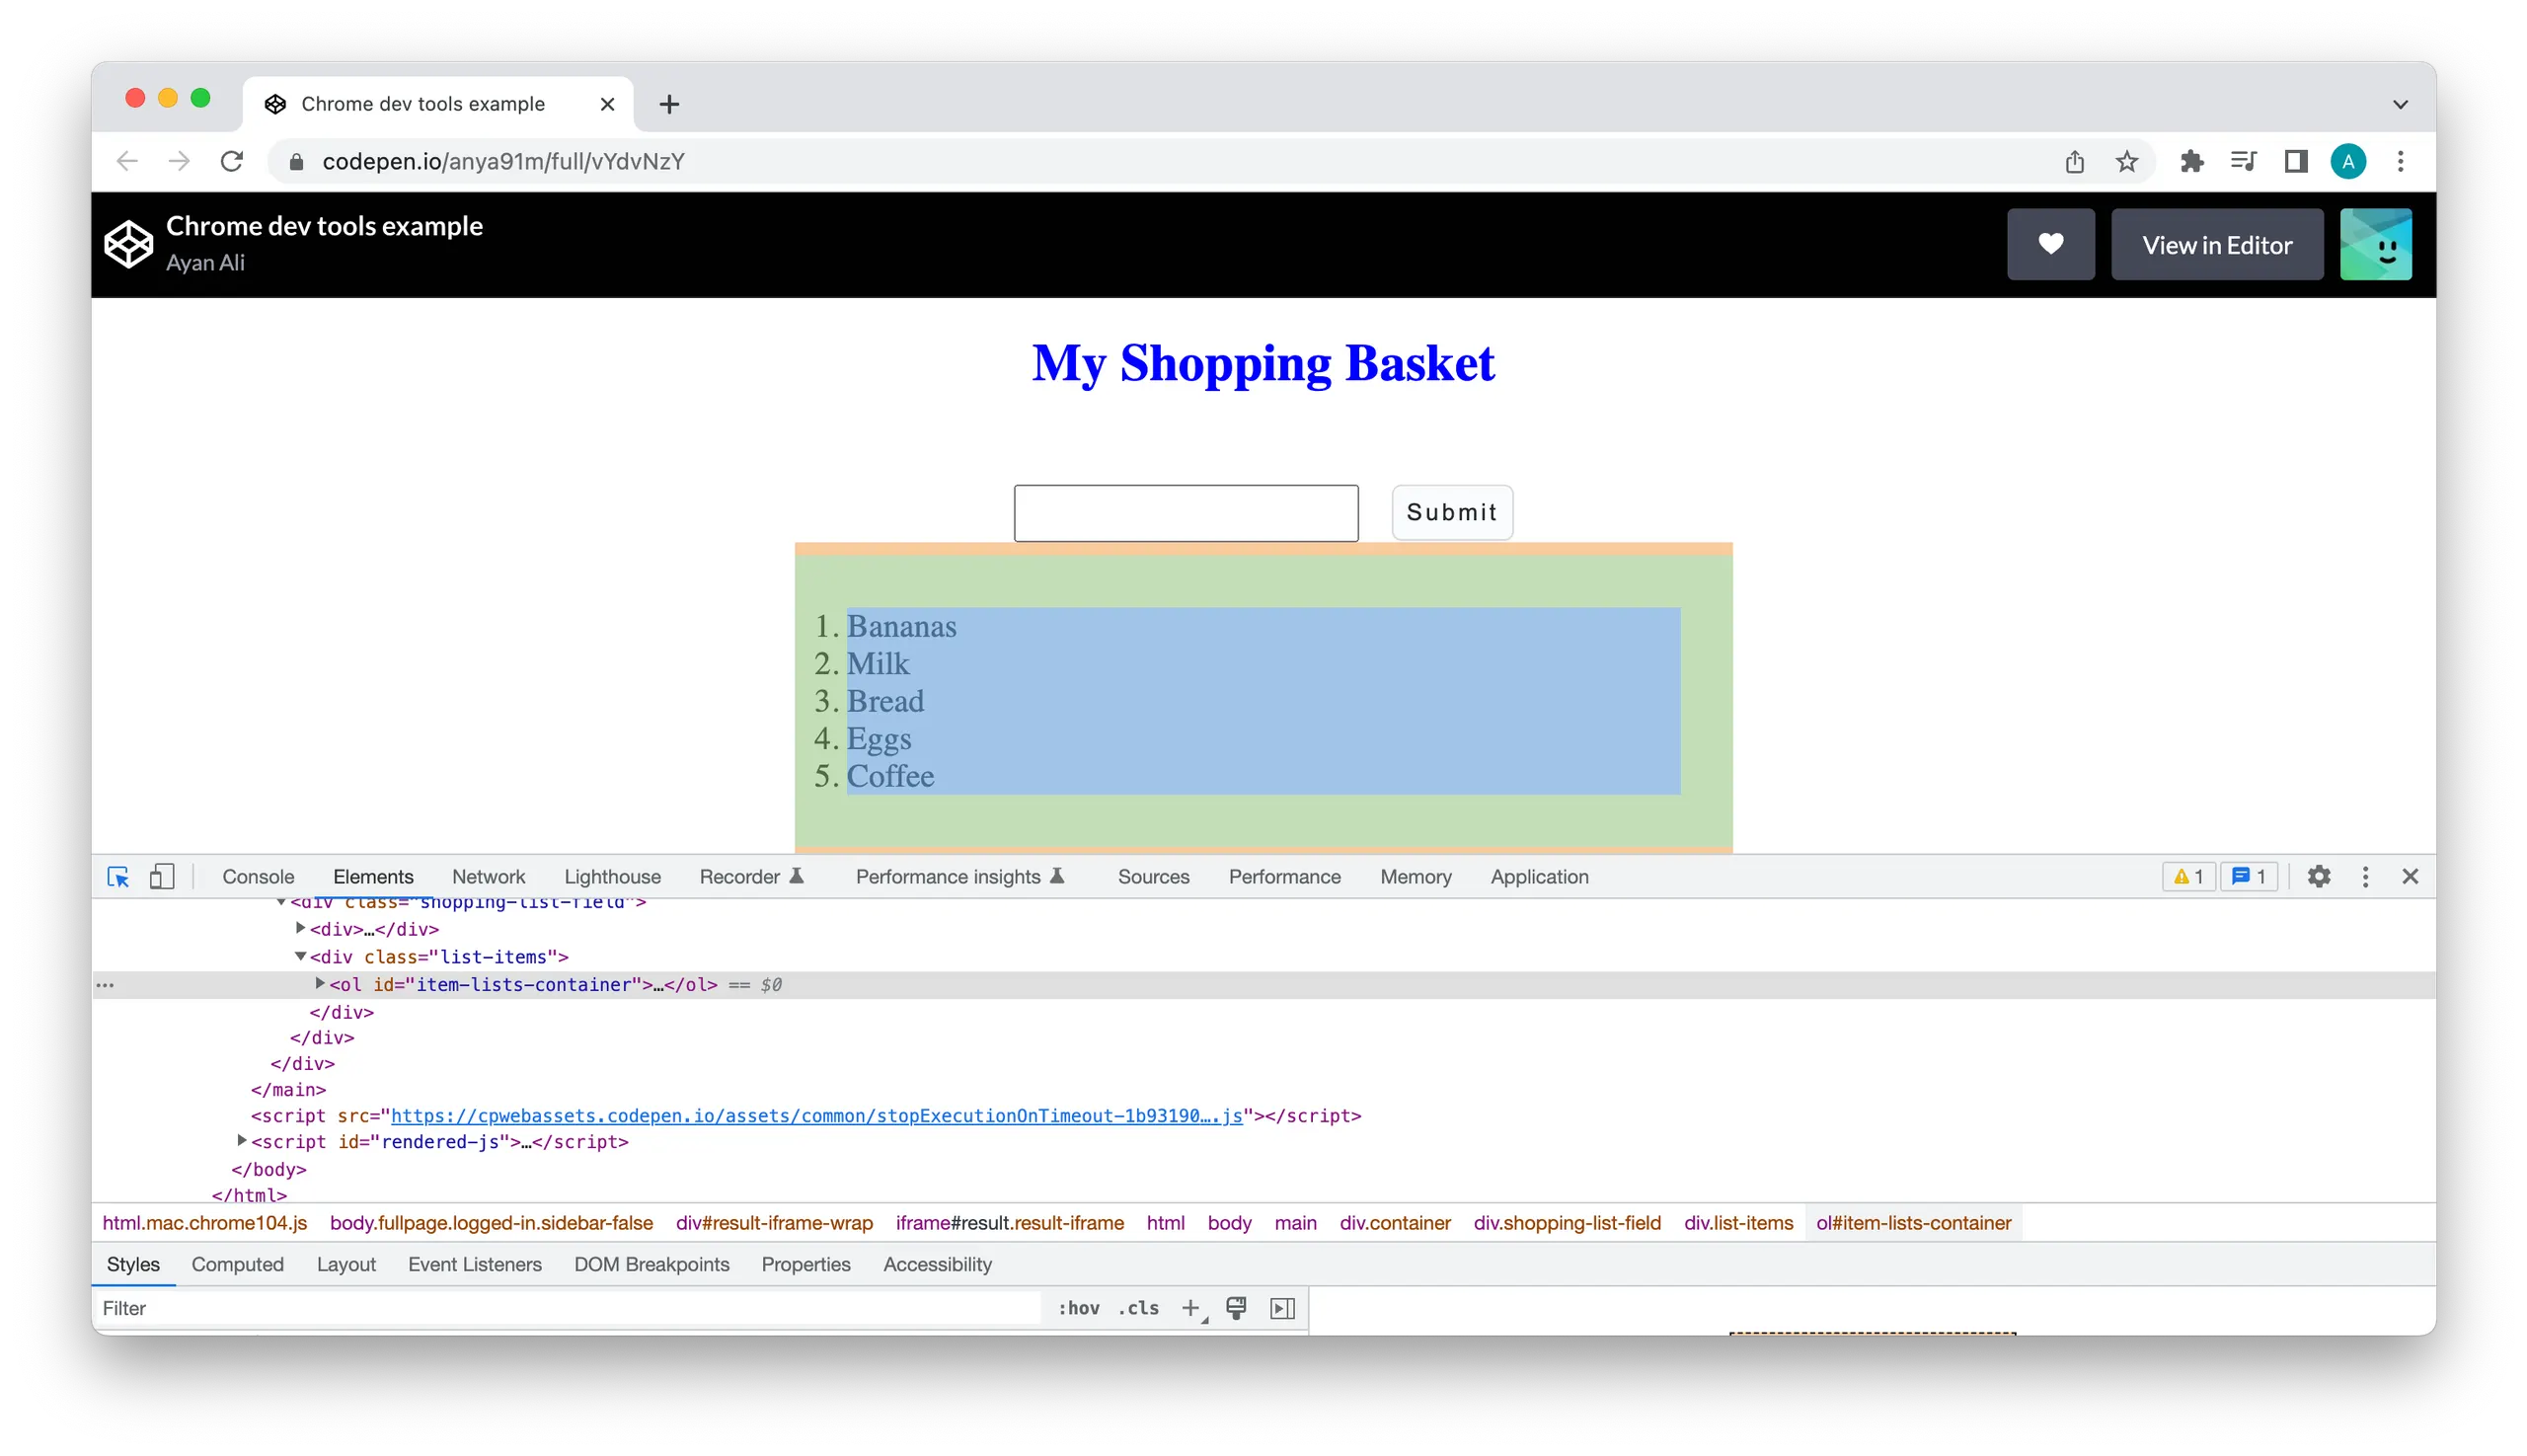
Double click on the
<ol>tag, you'll notice it is highlighted indicating it is editable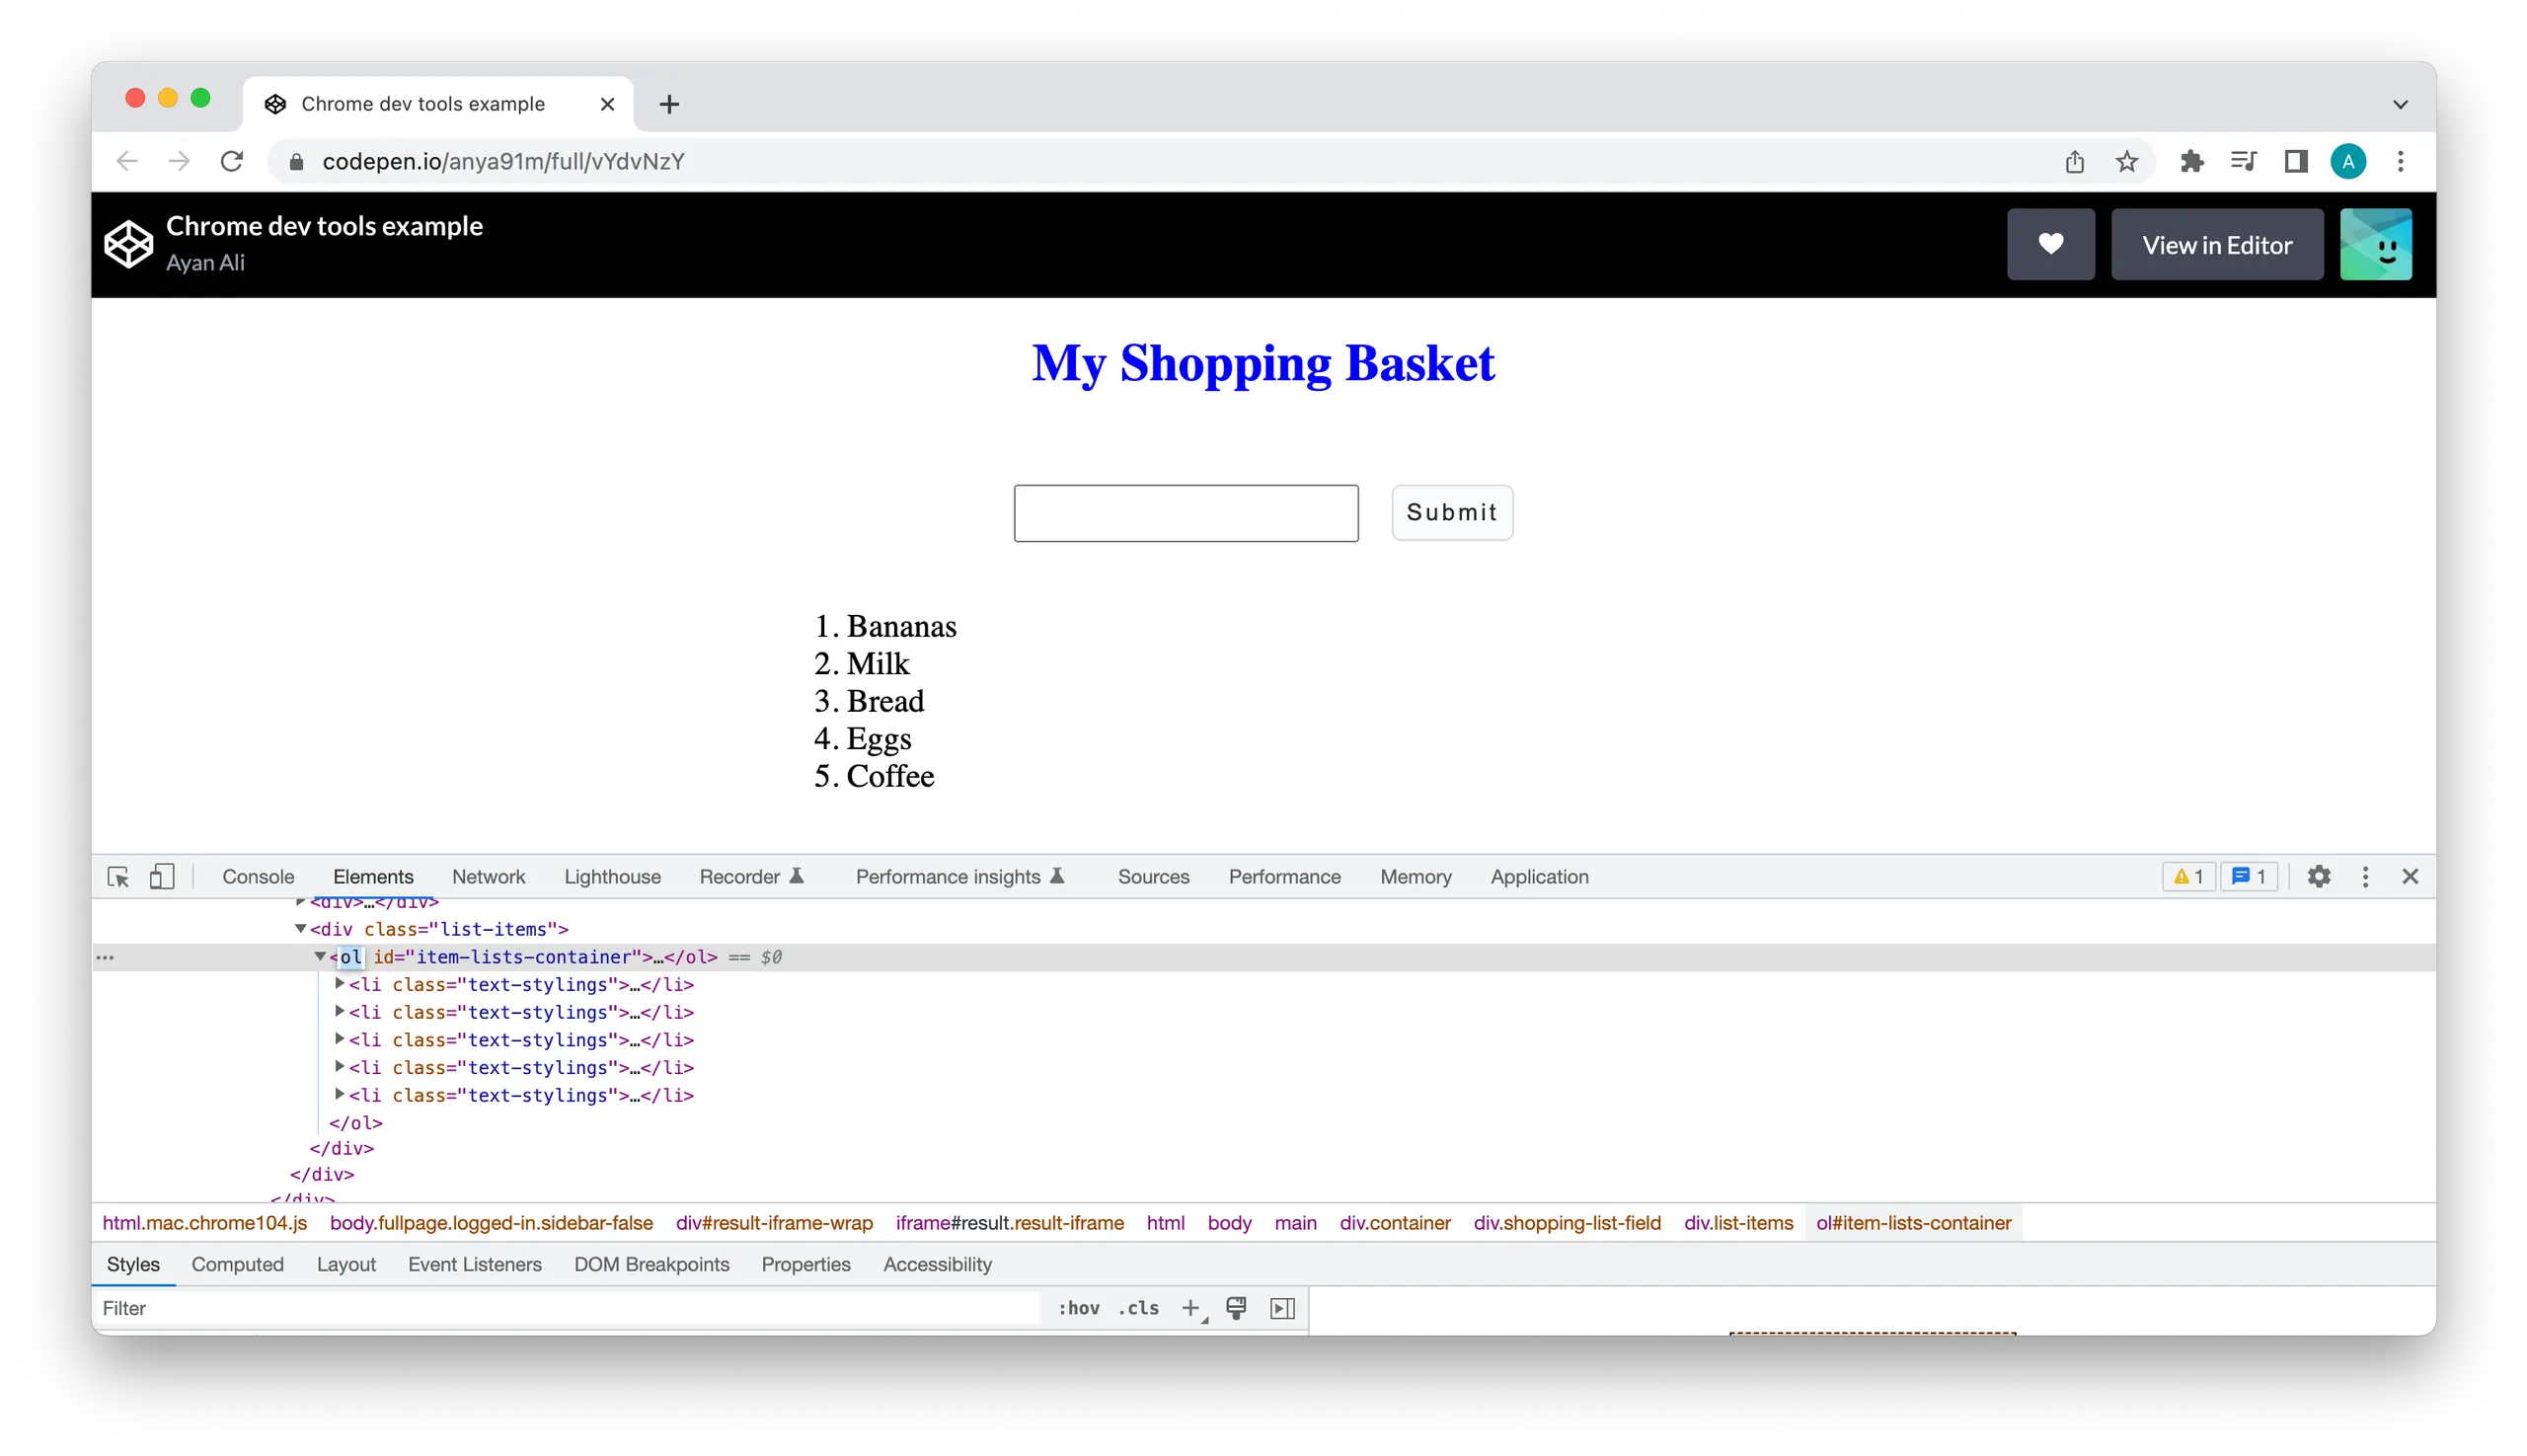
Go ahead and change this to a
<ul>tag and enter
<ol>tag is now changed to a<ul>and we visually see the change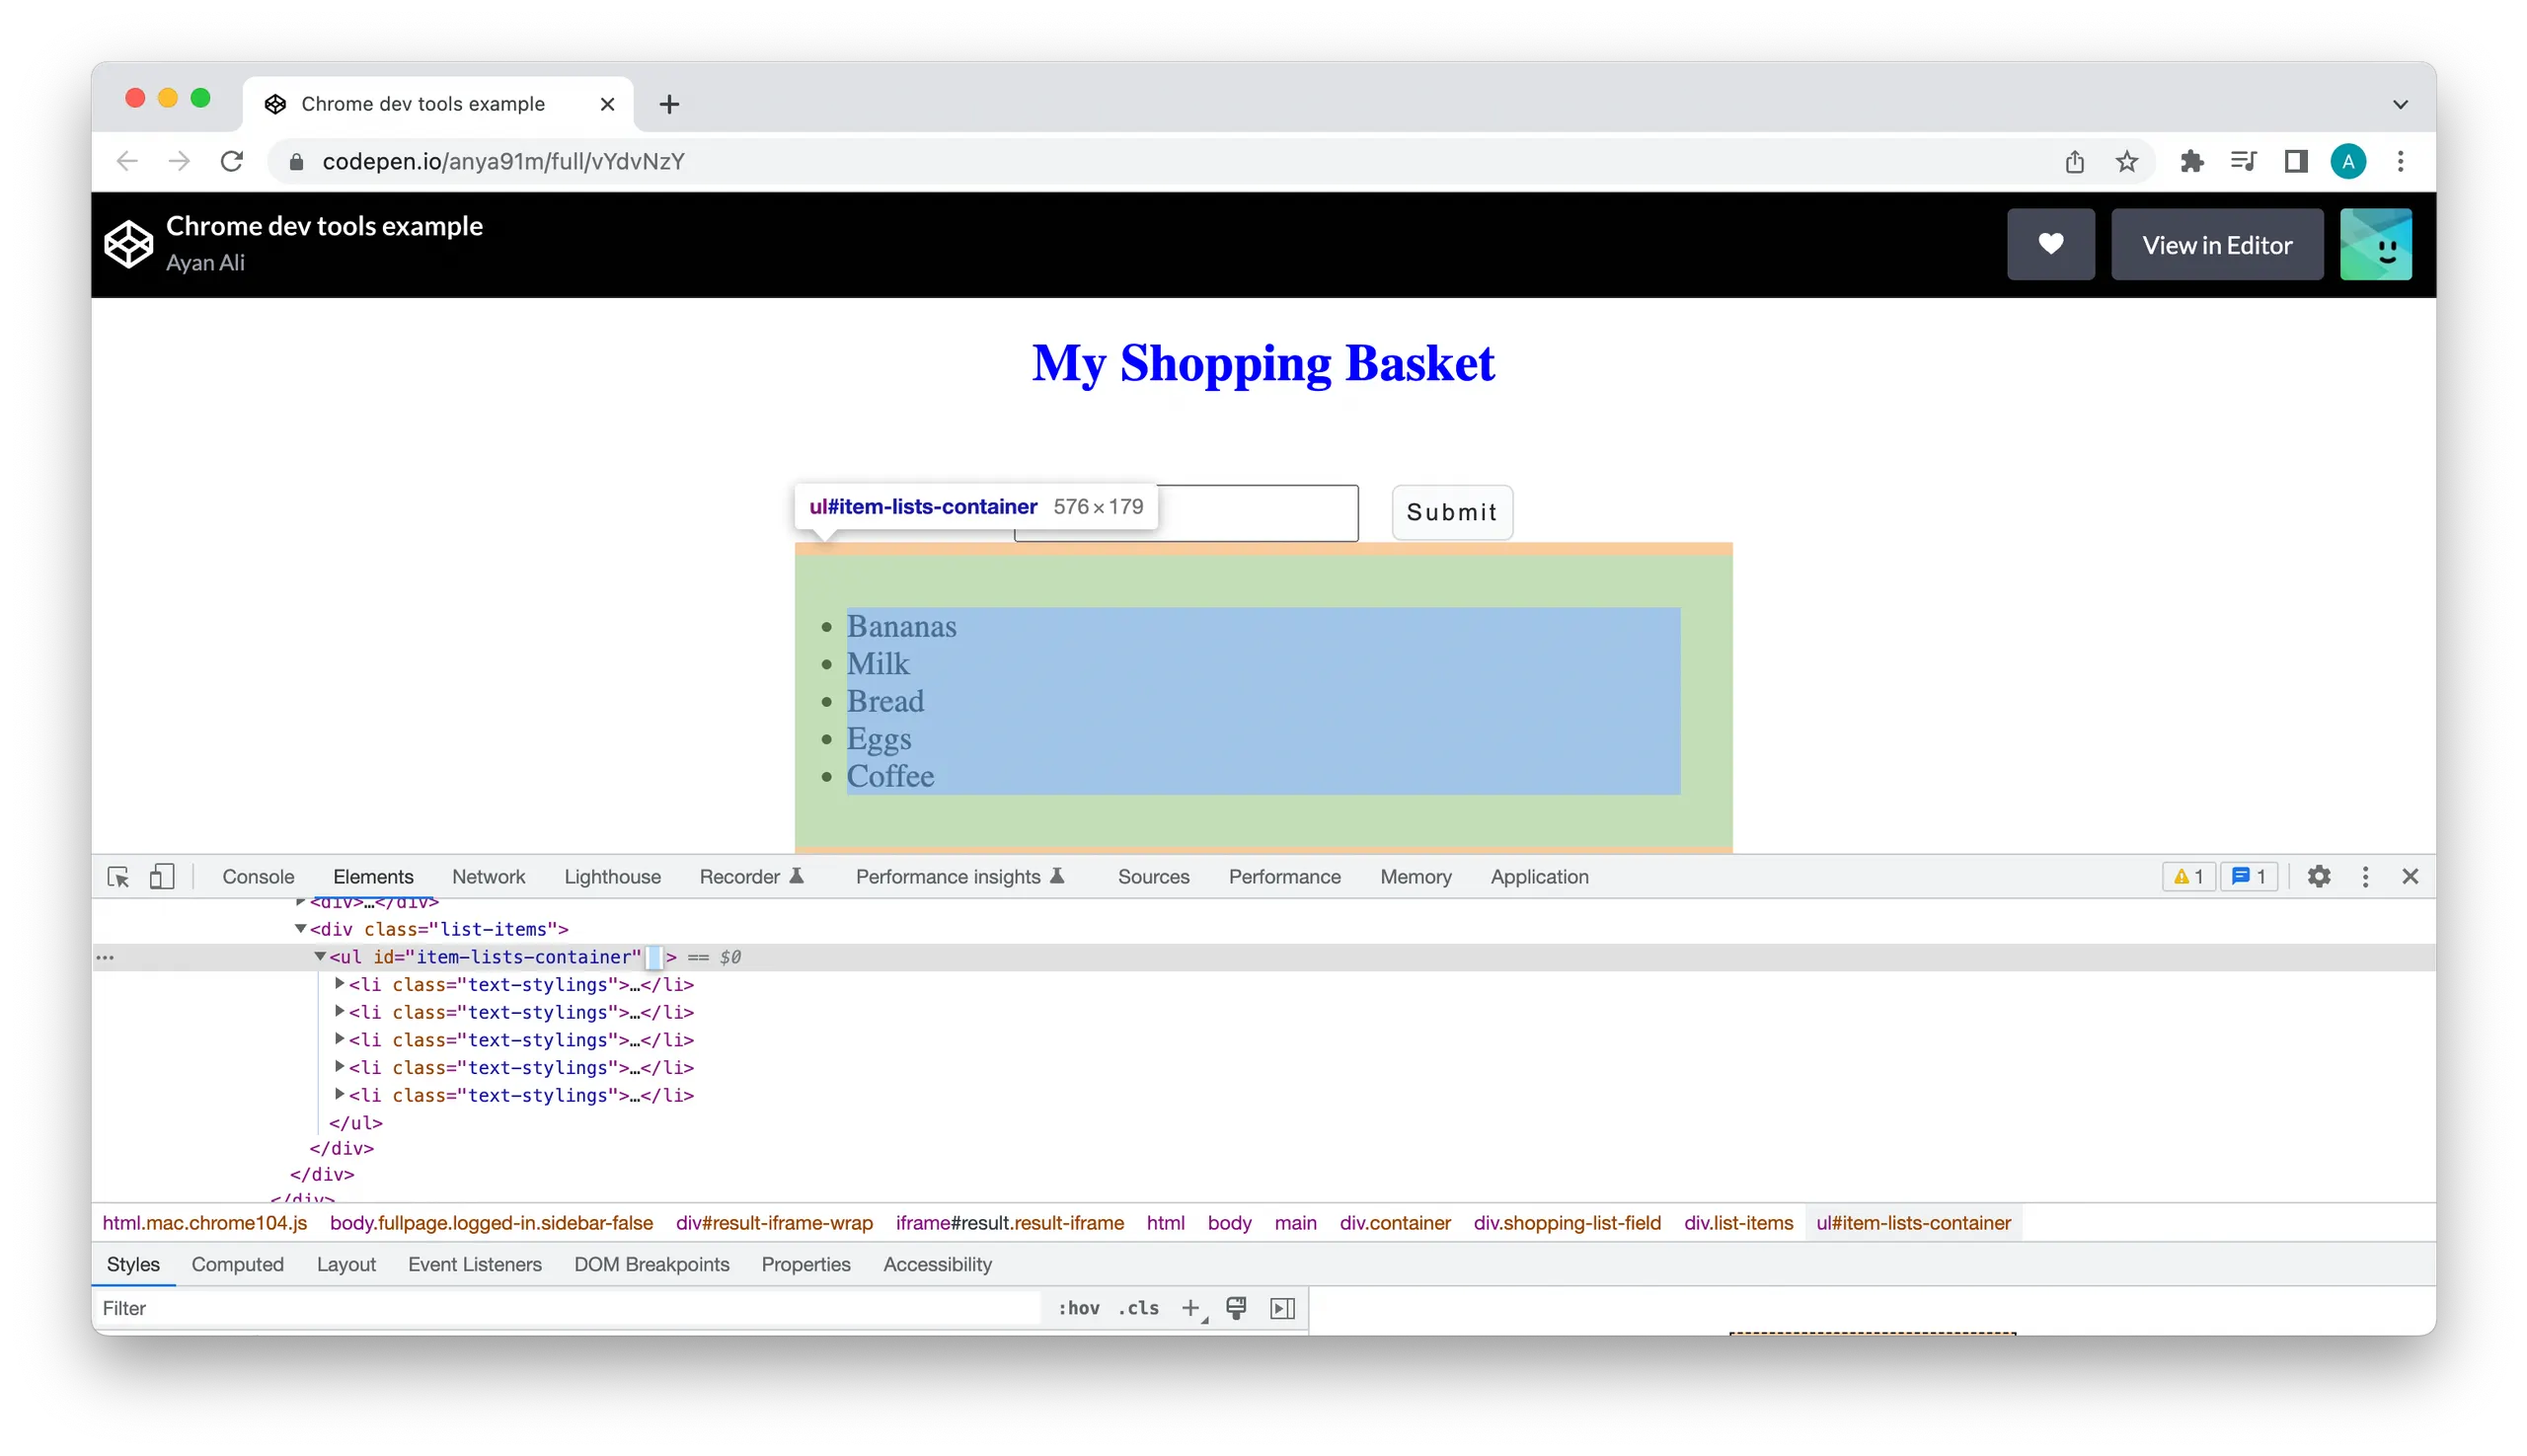
Modify node styling
We can also change the node attributes to make some stylistic changes. For example, we can change the unordered list items from the current black to red. This can be done directly in the node or the Styles panel by adding a CSS declaration to an element (in the following section).
Returning back to our example, let’s change the styling for our new <ul> element. We’d like to change the list items font color to red:
Double click
ultag and add following styling to the elements inline attributesstyle=”color: red”and hit enter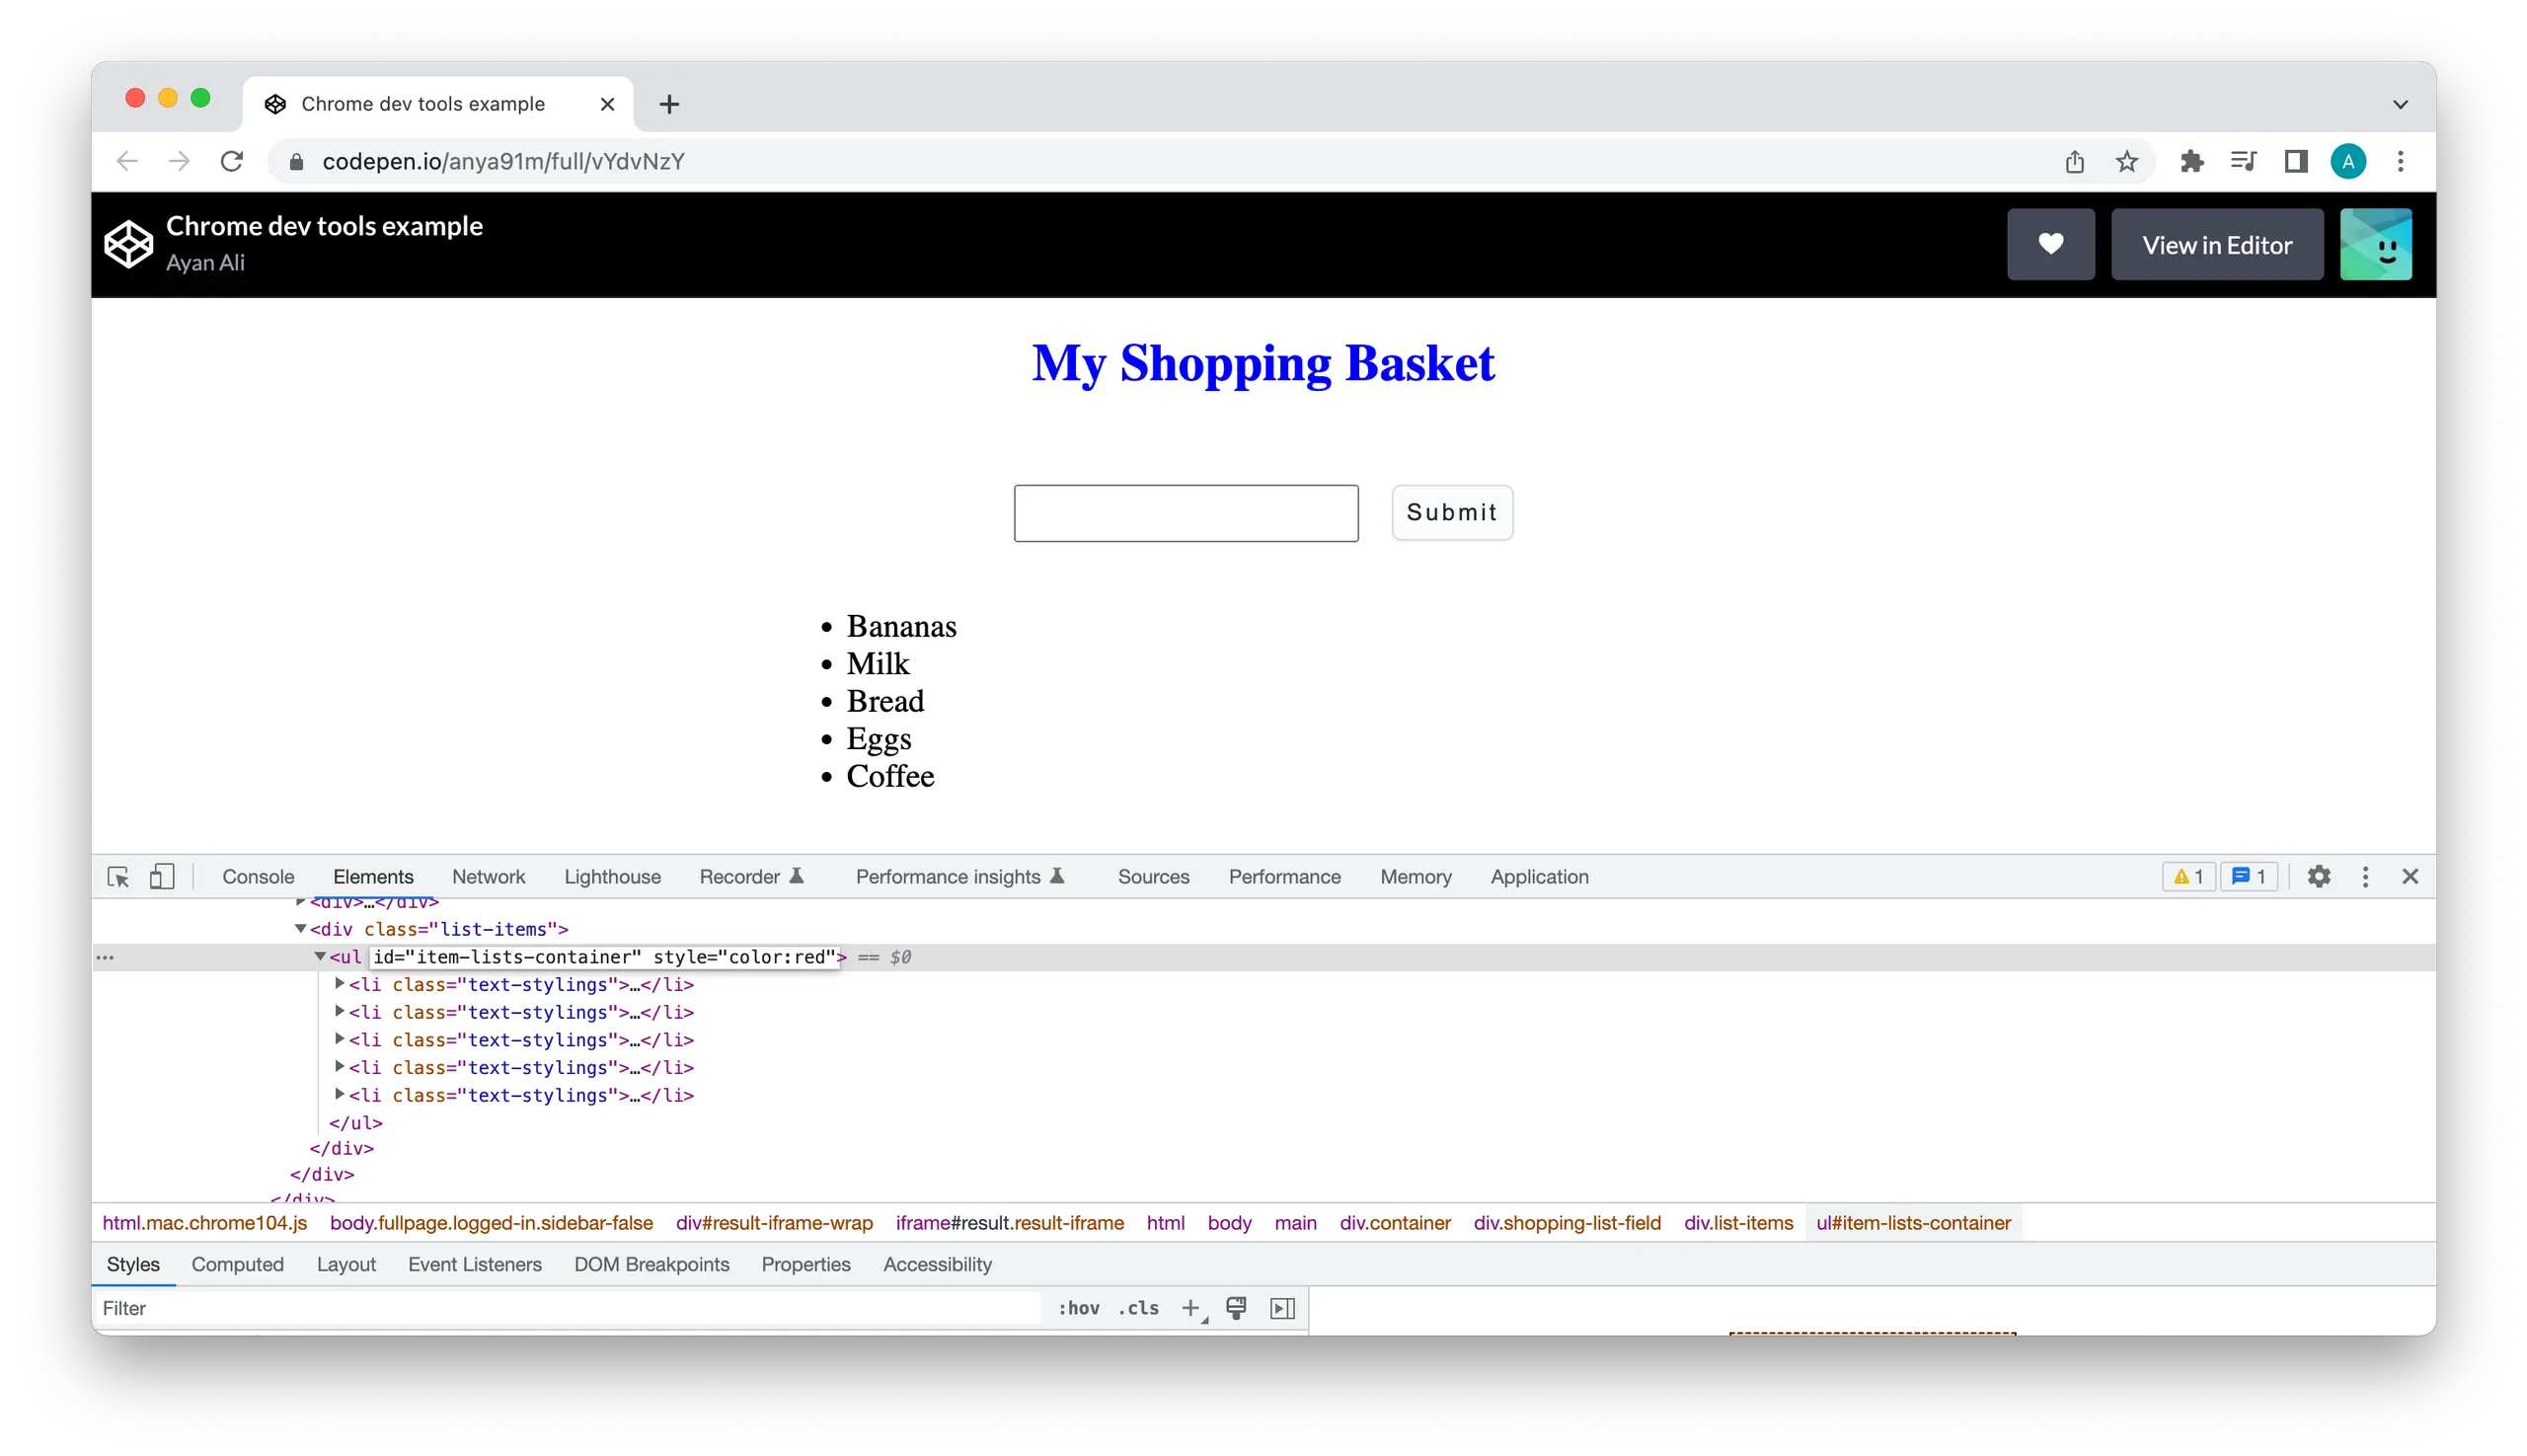
You should see the list items all change font color to red
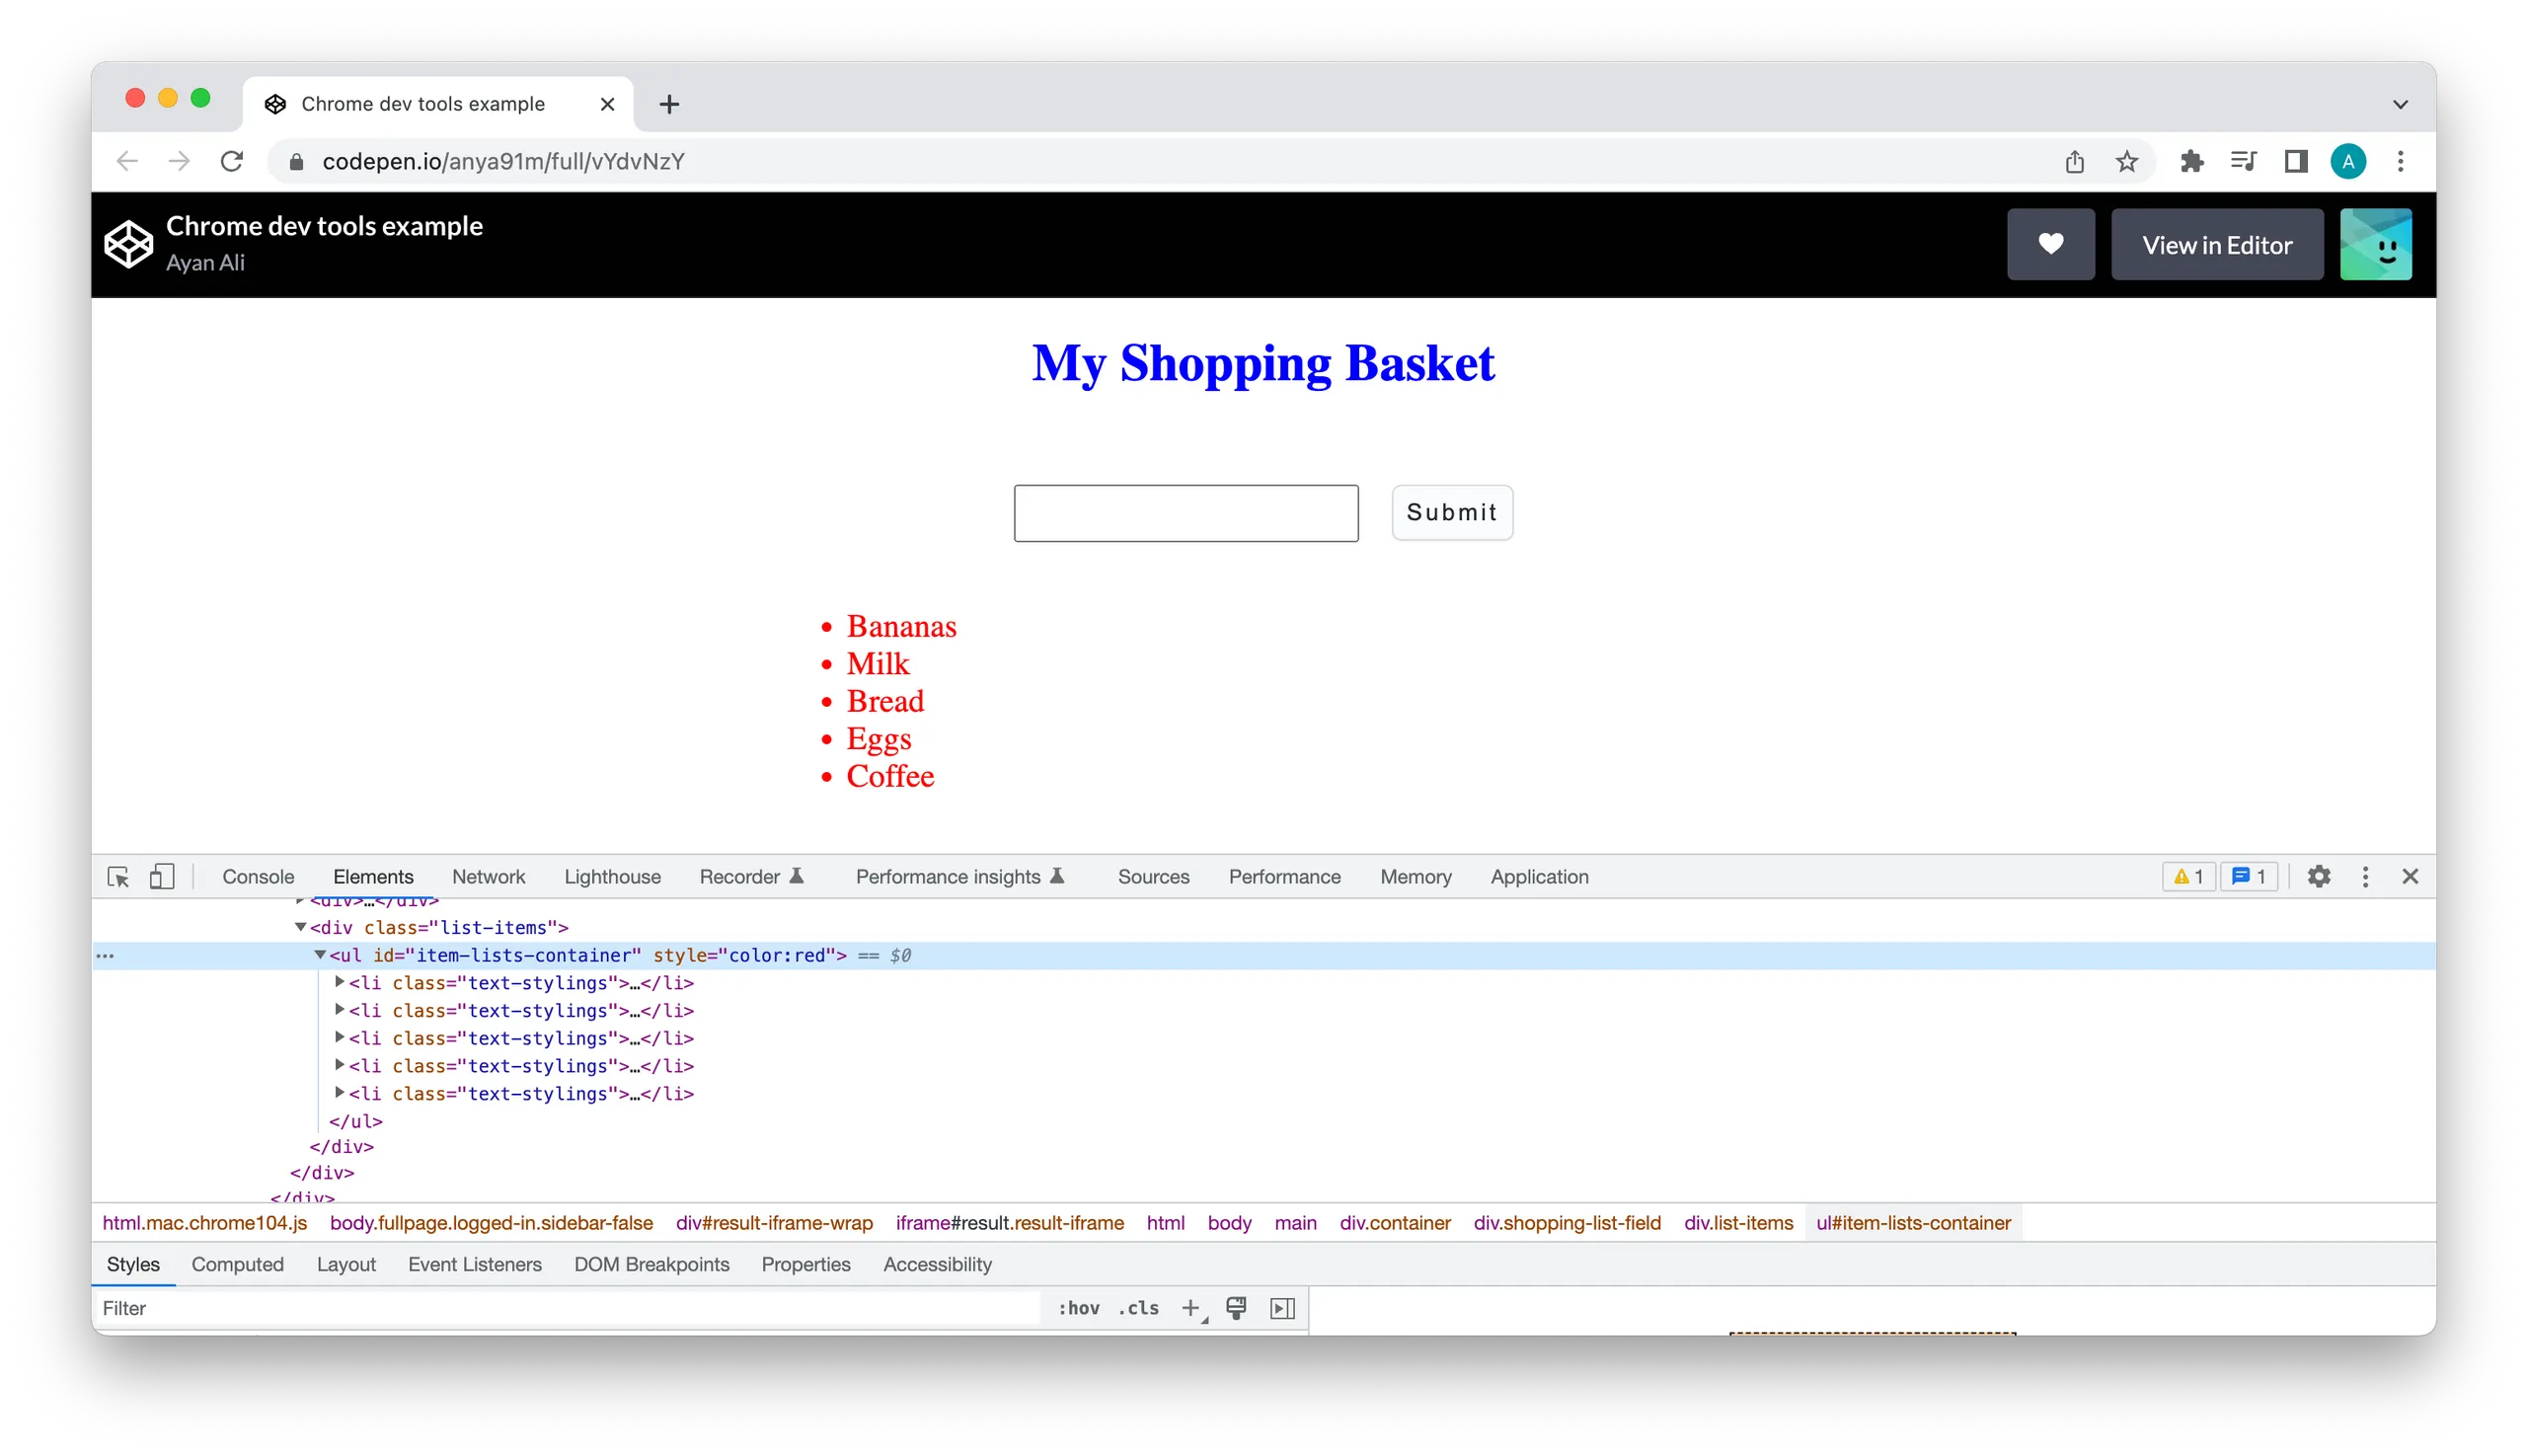
There are numerous other node edits available to you on devtools. You can duplicate a node, hide or delete one to see how that would impact page structure.
CSS declarations
Make generic CSS styling edits and not just individual node attribute edits. Let's go back to the shopping app. Say we want to try to change the list font styling. We can do this by adding a CSS declaration to one of the <li> as follows:
You'll notice that the declarations made are also added to the DOM inline styling attributes.
Add class to element
We can also check how a CSS class is applied to and removed from an element. For example, we have the following CSS class .clicked, which is applied to a button when clicked. .clicked has the following CSS styling:
.clicked {
  outline: 1rem solid;
}
We can check how this is applied by adding the class to the button. To add a class:
In styles panel select .cls
In the pop-up text box, type the class you want to apply and hit enter
Notice how the class appears with a checkbox that can be toggled on and off to add and remove the class respectively.
Simulate states
Devtools supports several CSS pseudostates including: :active, :focus, :hover and more.
You can simulate states in the Styles panel. We can find out what happens to the button in our shopping app when a user hovers over it and simulate this in devtools as follows:
go to the Styles tab
click
:hov
Computed styles
Similar to the styles tab, the Computed styles tab also displays the styles applied to an element. The difference is that the computed tab displays an exhaustive list of the resolved styles. These are the resolved styles declared in the stylesheet, styles acquired from inheritance and those derived from the browser's default behaviour.
For example, the div container in the shopping app is given a CSS width value of 30vw, as seen in the styles panel. If we open the computed tab, we see this is resolved to 786px, the exact value rendered onto the page.
This is particularly valuable when debugging why the CSS applied to an element is not working. If an element has two conflicting CSS rules applied, CSS has mechanisms that determine which value is ultimately resolved: cascade, specificity, and inheritance. Inspecting the computed tab allows us to investigate which rule wins the conflict and is rendered.
Going back to our shopping app. We have the following styles applied to all h1 elements:
h1 {
  color: red;
}
However, the following styling is applied to the following h1 with the class .heading
.heading {
  color: blue !important;
}
There are two conflicting CSS values defined here. Let’s see how the browser reconciles this.
You'll notice the heading class and h1 styles on the Styles tab. The colour value for the h1 is not applied to this h1 element. Instead, the value defined by the class is given precedence as it is higher in specificity and thus wins. Let's inspect the computed tab. This again shows us the CSS value that is rendered by the browser. Moreover, it also shows the other CSS value and which element this was applied to the similar styles tab. Unlike the styles panel, the computed tab also tells where precisely the styles are defined and directs us to the file and line number (highlighted in orange).
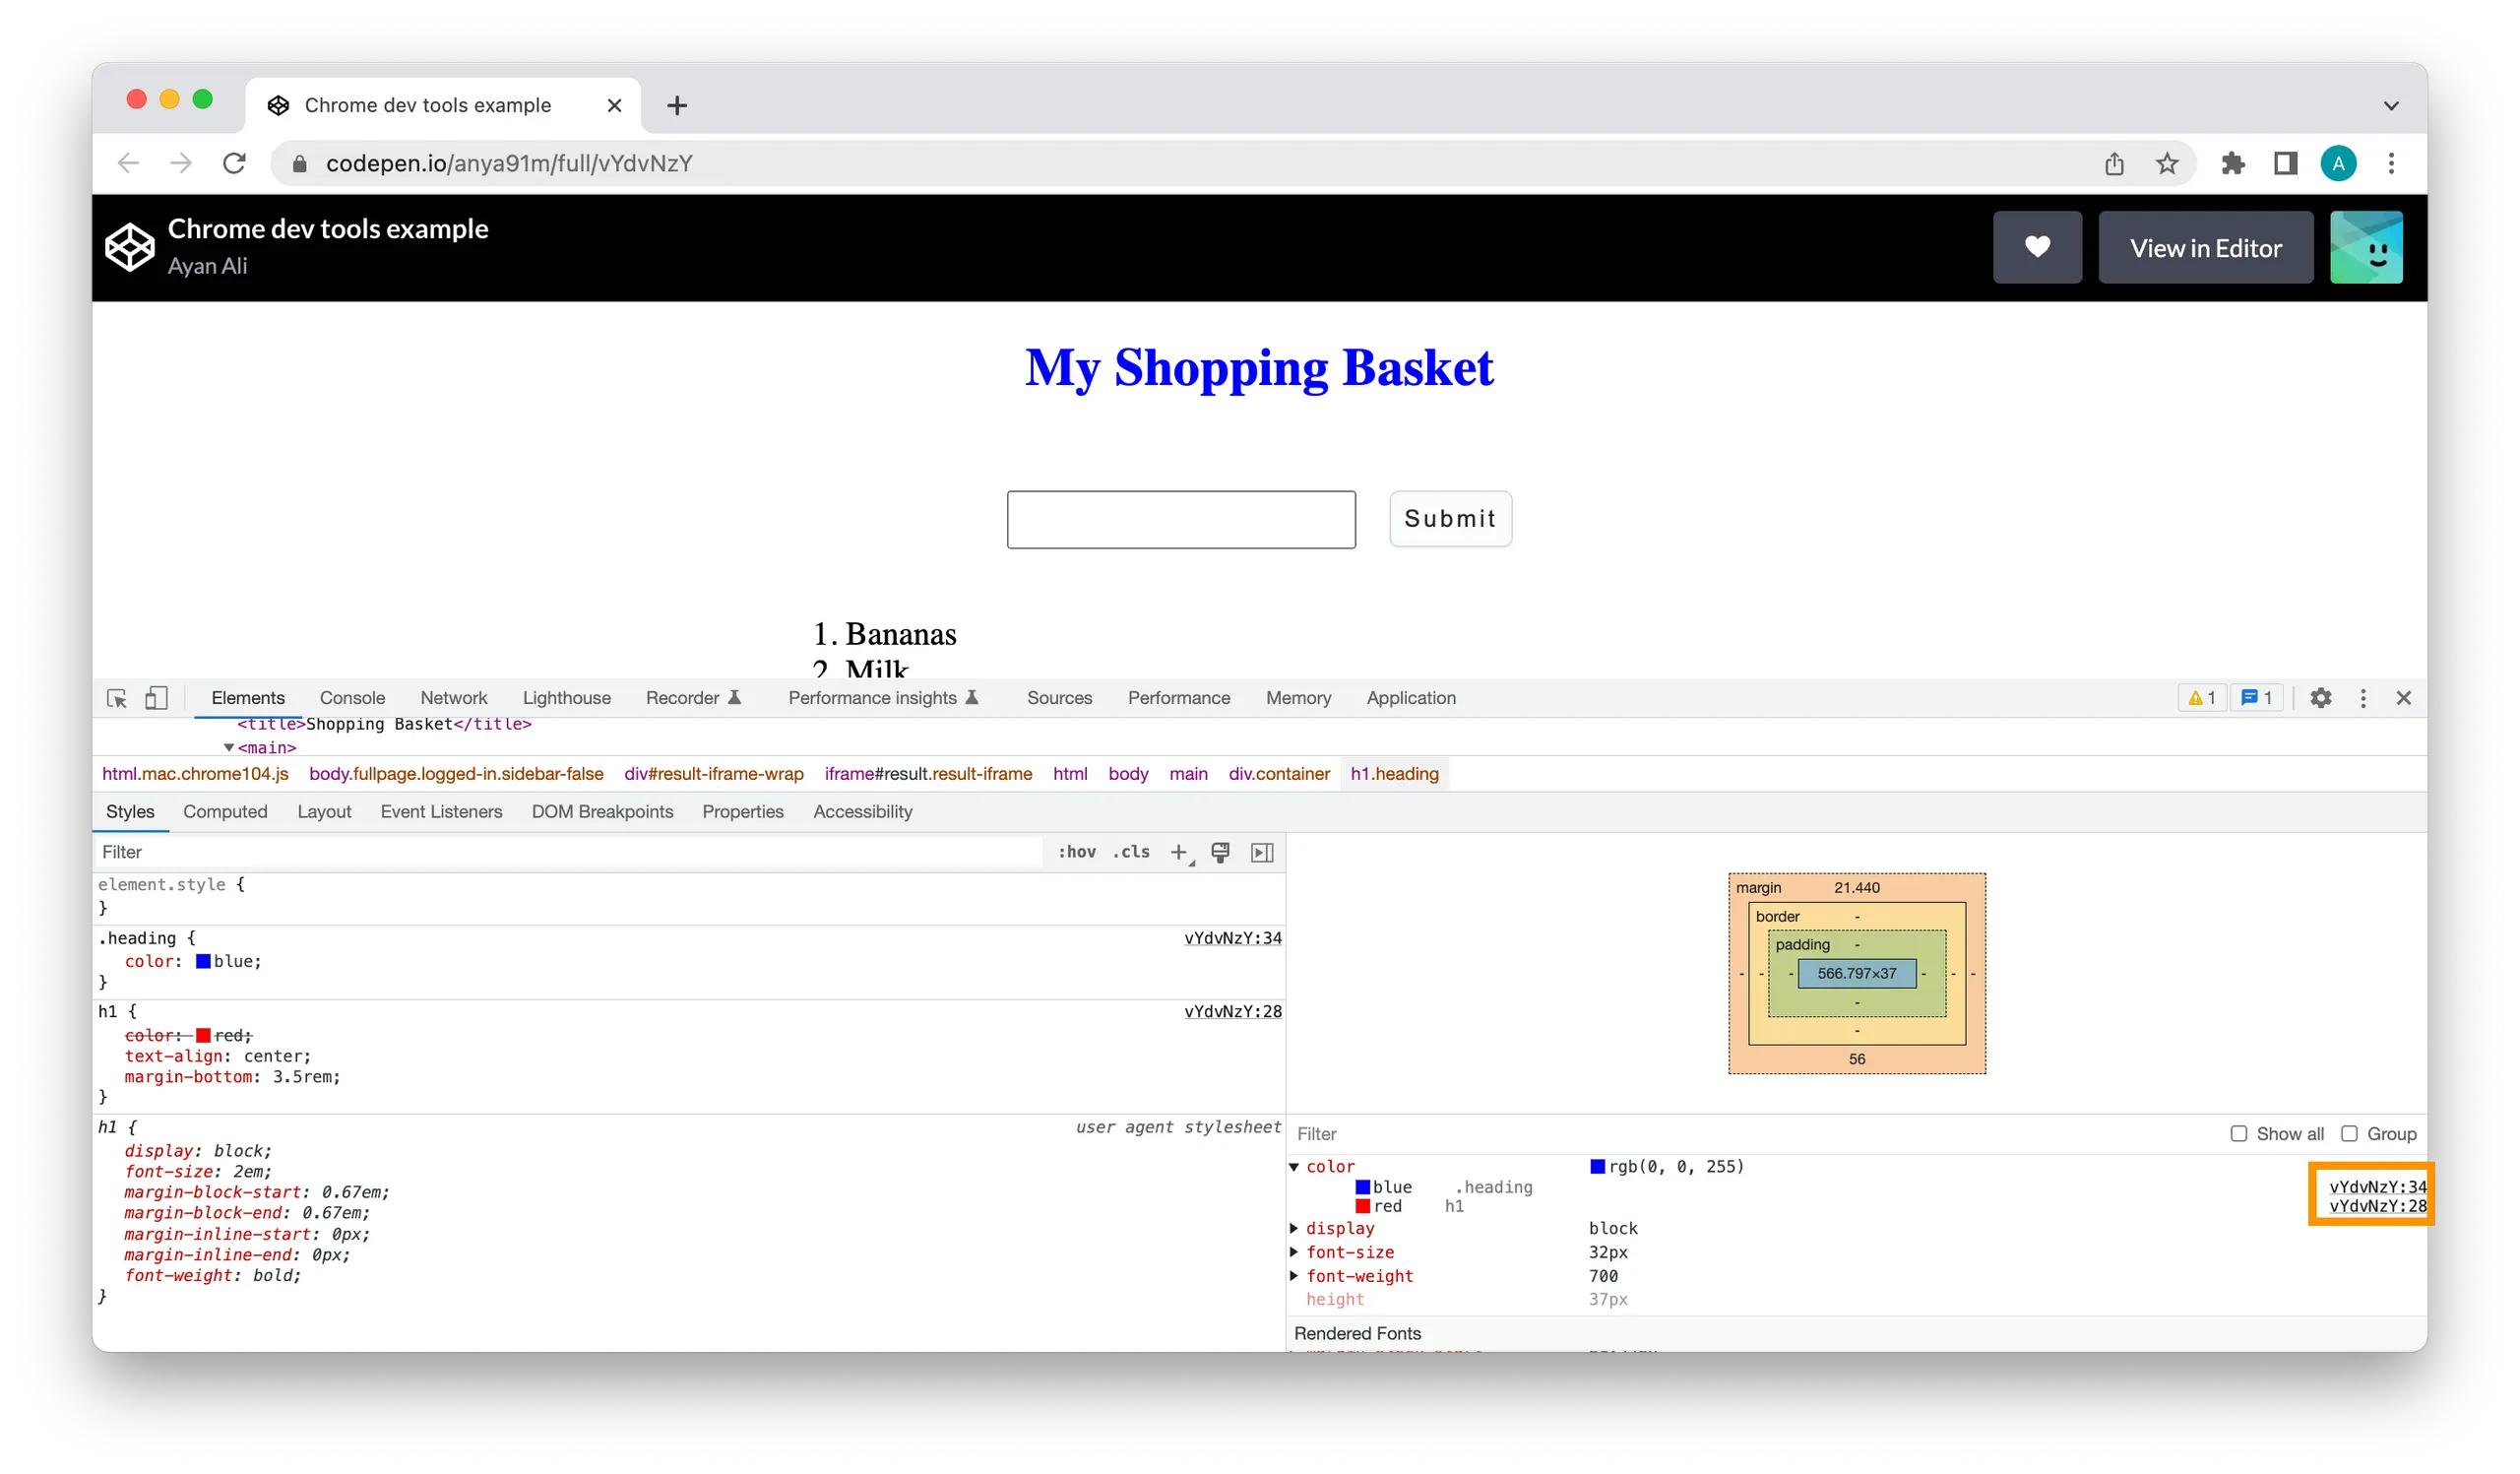
In the computed tab, we can also find the box model. The box model presents a visual representation of an element. Here we can see an element's margin, borders and padding etc. We can also play around with the values here and visually see how things are rendered on screen - especially great for testing out changes before making any code changes.
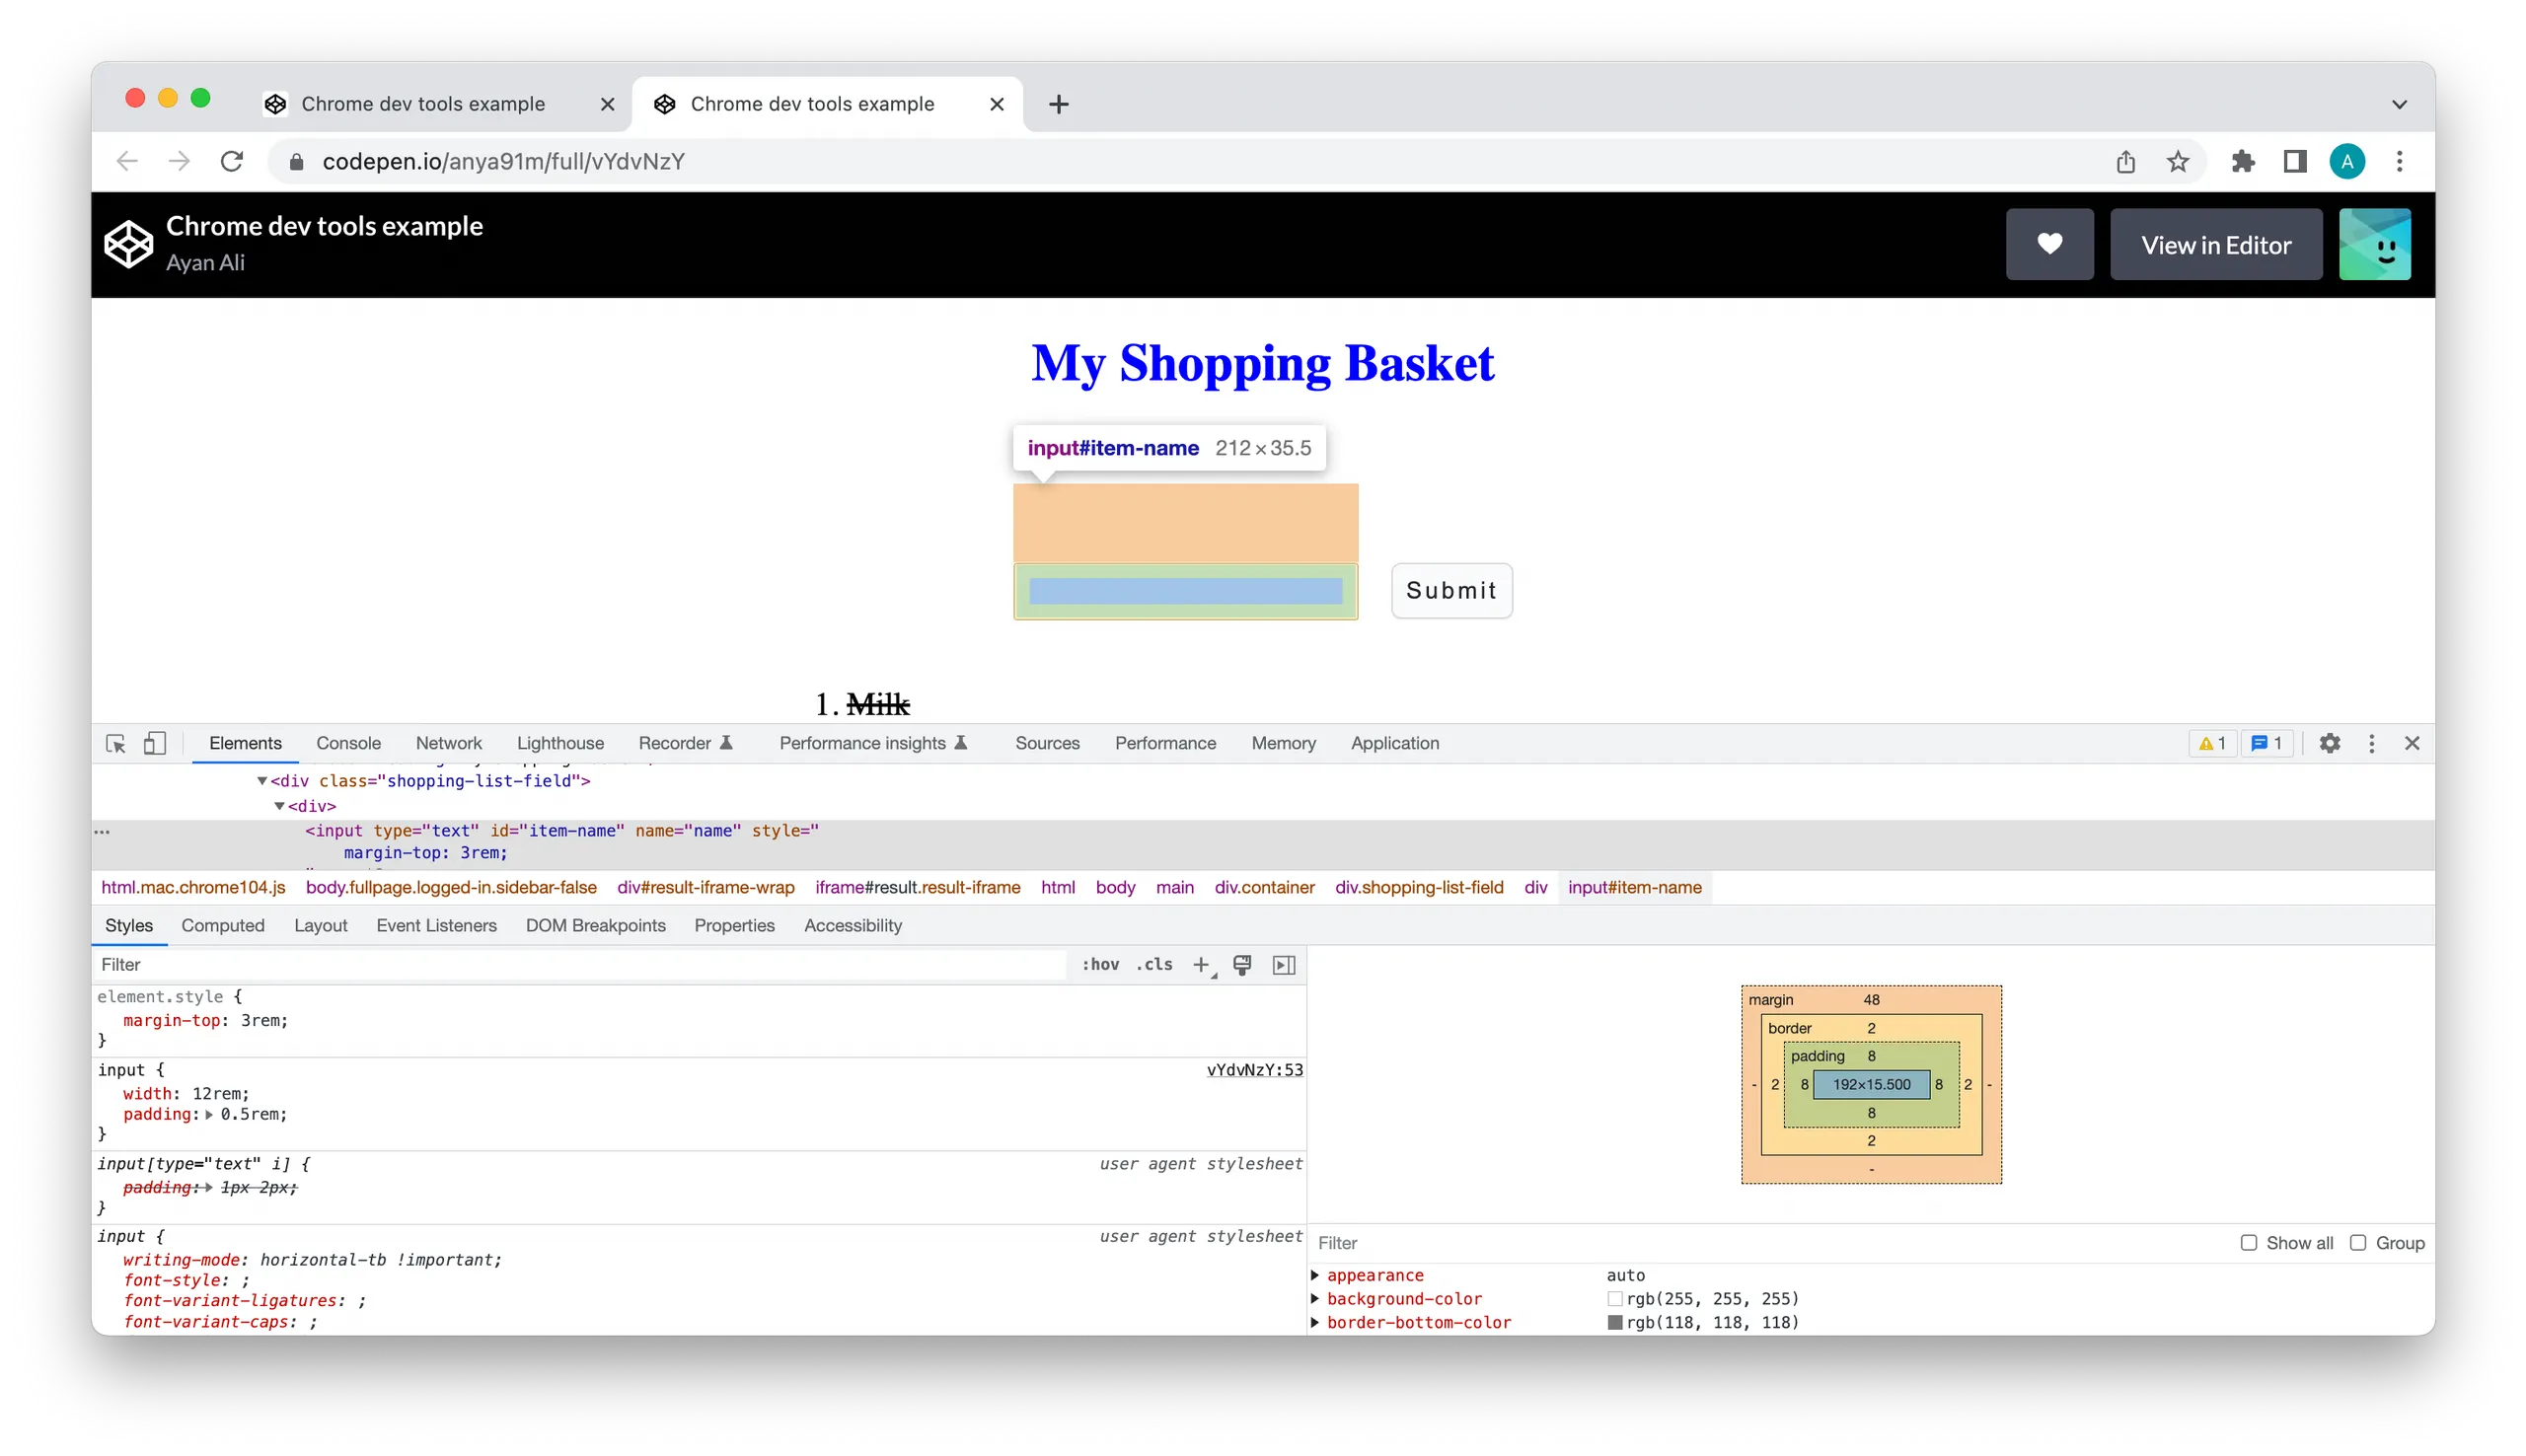
We can inspect the input field of our shopping app to see whether the margins, paddings and borders need adjusting. You can select the node in the Elements panel and head over to the computed styles sidebar expanding the box model window, where we can hover over the various dimensions of the elements box model.
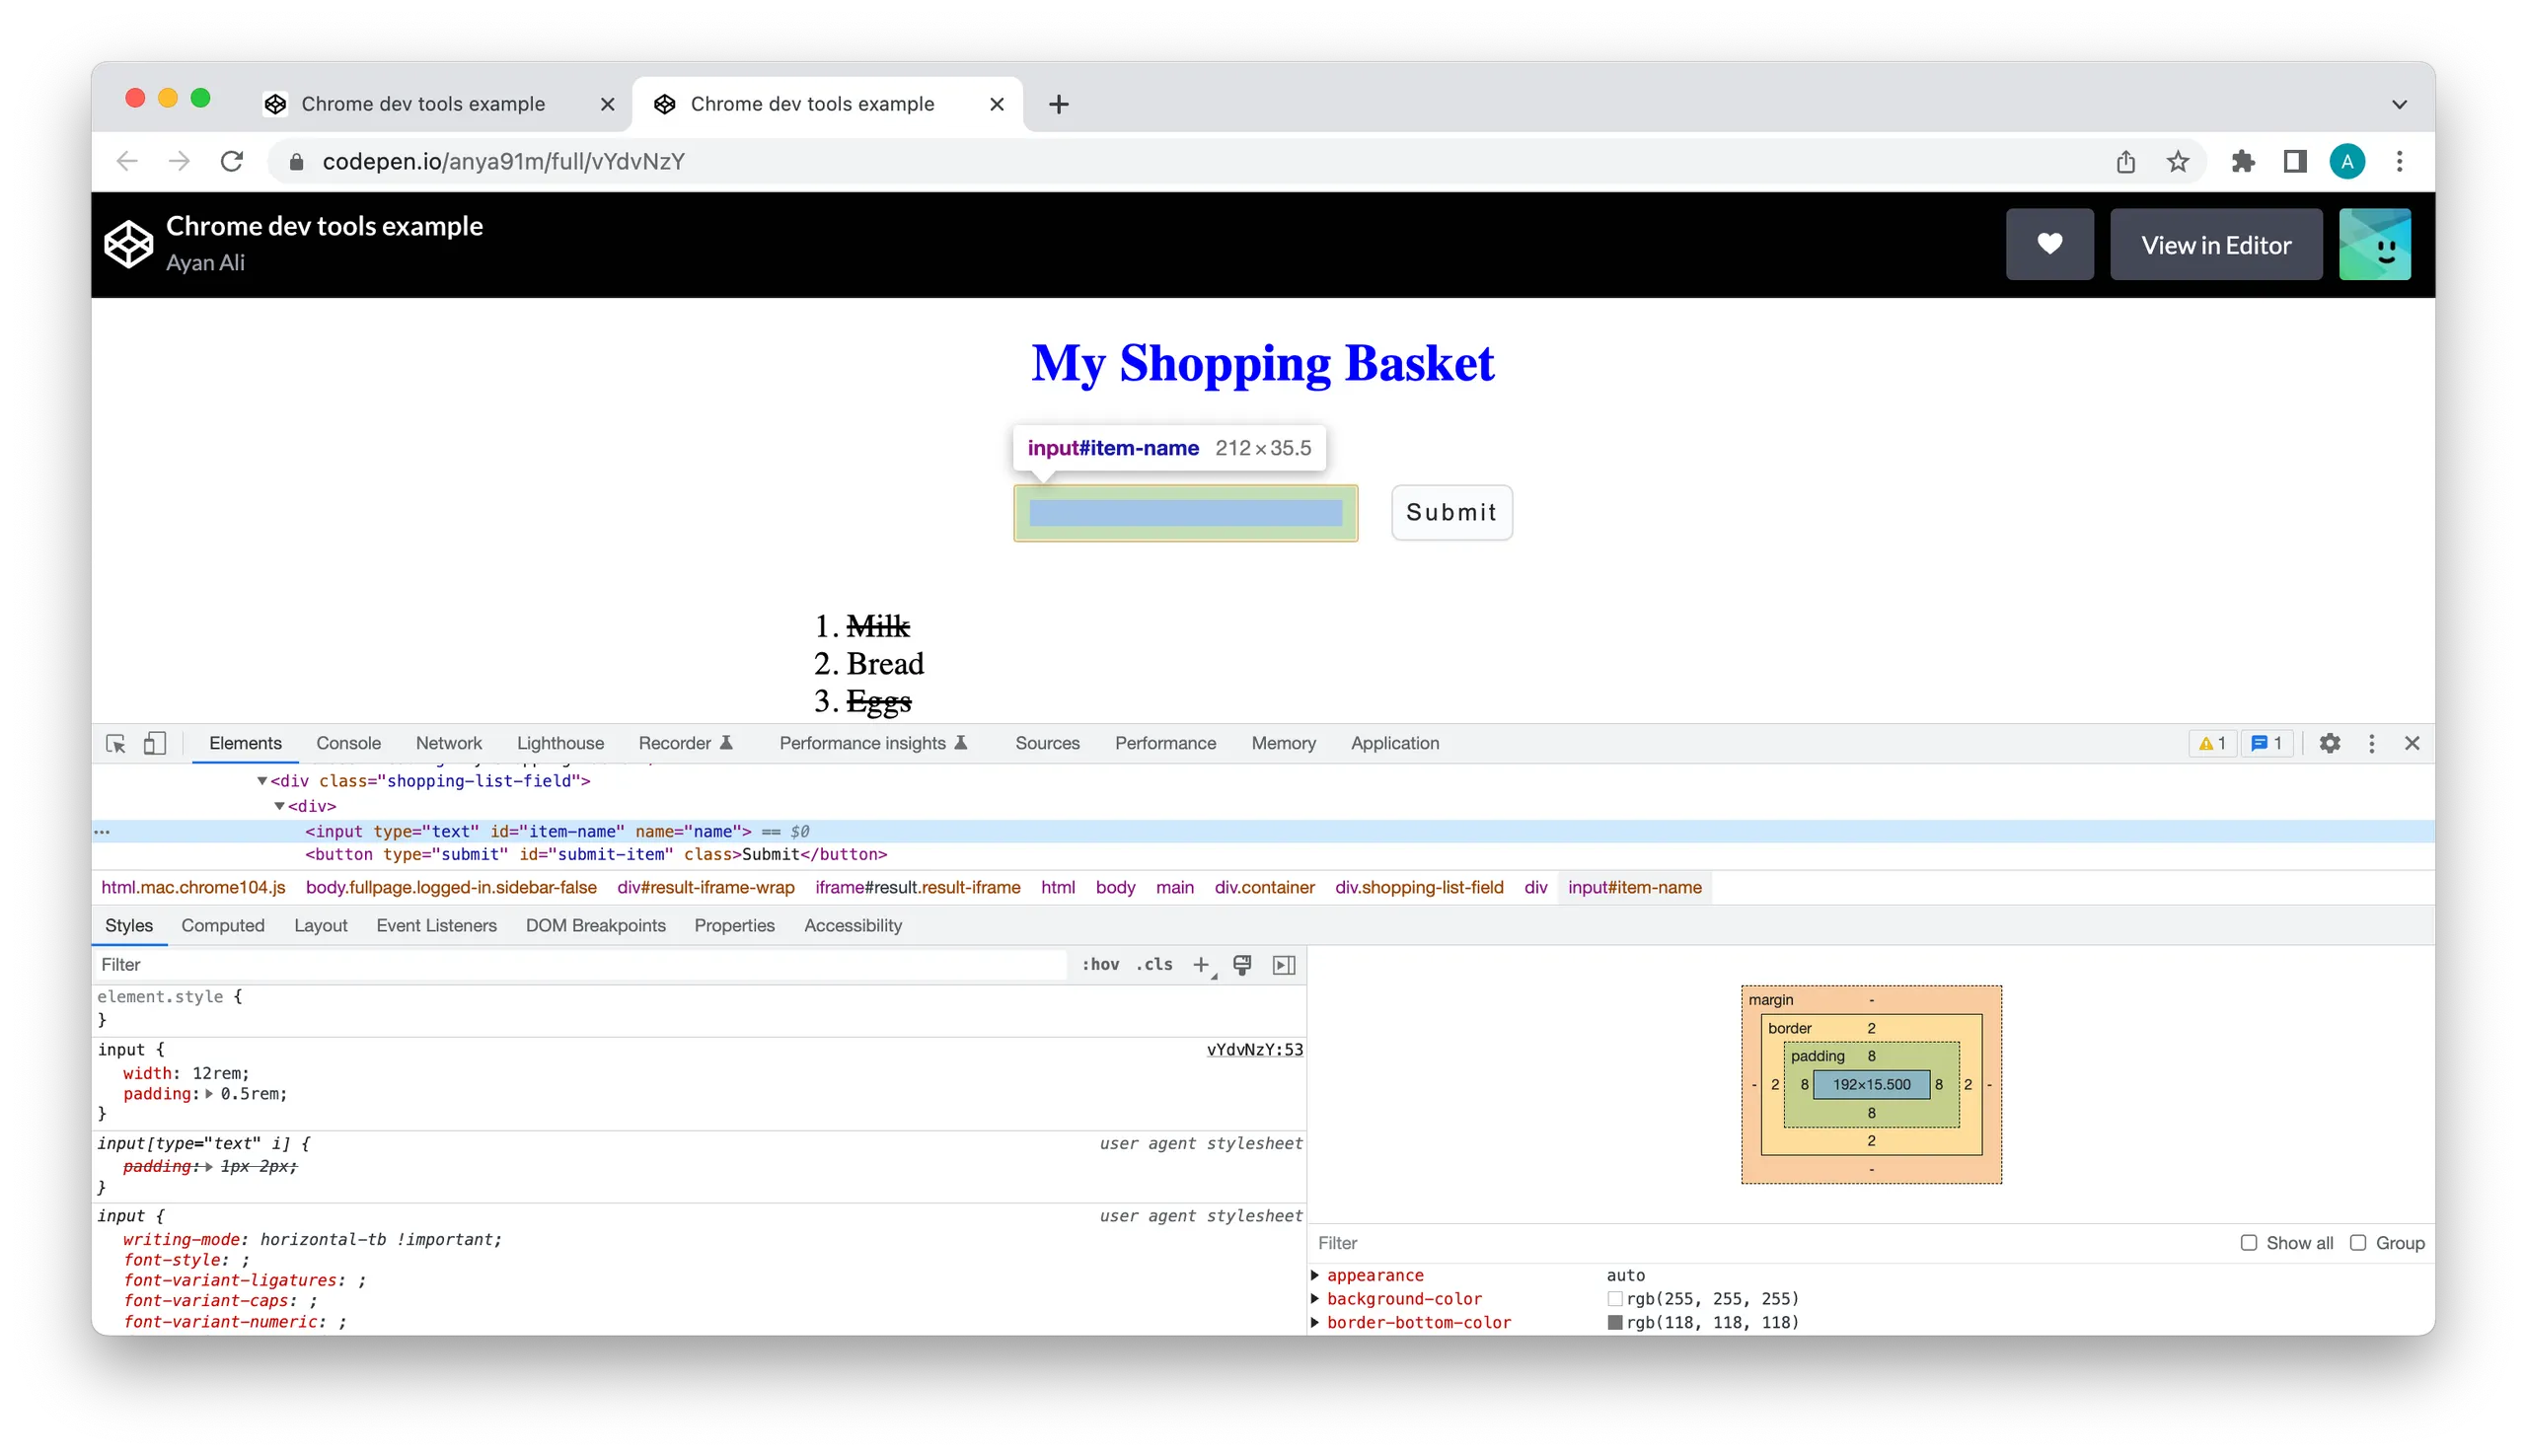
For example, as in the demonstration above, we might want to add a bit more margin to the top of the input box model following inspection:
Conclusion
We've explored and implemented some of the main edit functionalities chrome devtools offers in this second part of our intro to devtools series.
In our next instalment of this series, we'll explore how we can inspect our application on chrome devtools and go into the debugging process and how devtools facilitates easier debugging.
Devtools series:


