Introduction to devtools: Chrome DevTools - a basic overview


Developers spend a lot of time debugging code. We're always looking for new tools and technologies to make our work easier. Chief among the web developer's toolkit is the browser developer tools (devtools). Devtools are built-in browser tools that allow developers to inspect and interact with their applications.
Devtools are an integral part of the debugging process. In this blog series, I share a basic overview of some of the core functionalities of the Chrome devtools that can help you better debug and understand your app.
In this post, we will:
Take a brief look at the history of debugging before devtools
Make sense of the core features of chrome devtools
Take a quick tour of the chrome devtools tabs
Although this series will focus on the Chrome DevTools, there are other browser devtools, e.g. Firefox developer tools and Safari. Generally, most browsers support the core features discussed here. However, it's recommended to check out the relevant documentation to learn more about each browser's functionalities. It's also good to be aware of the constant evolution of browser devtools. The DevTools team at Google are constantly updating Chrome with new features to enhance the developer experience. Find out more about updates and other features here.
By the end of this series, the debugging experience using the Chrome DevTools should (🤞🏾) be a breeze the next time you open inspect!
Debugging before devtools
Before diving into the world of devtools, let's rewind to a time when devtools didn't exist. How did developers debug web apps?
Two main approaches to debugging existed around this time:
inspecting source code
calling the alert method
Anyone who opens the source code will quickly realise how cumbersome it can be to debug numerous lines of code running endlessly. Regarding javascript (JS) debugging, the alert method was the closest approach to output JS values. However, this came with several limitations:
i) alert is a blocking method - this stalls any engagement with the browser until the dialog box is closed, taking over the entire browser experience. For example we can say var = 10
ii) alert can't show JS objects - the method can only output primitive values. If you're working with objects, you wouldn't be able to see what this looks.
iii) alert could only be called one at a time. If you'd like to output the values of several variables, you would have to output them one by one.
DOM preview tools soon appeared on the scene, allowing developers to preview the DOM structure and see real-time updates. Much of what we can do in devtools is thanks to the wonders of the DOM. An object-oriented representation of a web page, the DOM has access to the properties, methods and events that allow us to manipulate the document's contents. It wasn't until the Firebug Firefox extension that developers could inspect, edit and debug the DOM within the browser - a game-changer for in-browser devtools.
Making sense of devtools
We've come a long way since page source and alert debugging days.
In-browser devtools offer numerous features that help us better interact and understand our web apps. We can categorise these features into the following core capabilities: edit, debug, profile and audit.
Edit
Interact with the DOM and inspect and edit HTML, CSS and JS.
Debug
Inspect and debug HTML, CSS and JS. Add HTML breakpoints to find out where our code is breaking and where JS code is being called.
Profile
Inspect network activity, see page requests in real-time, and measure performance.
Audit
Additional tools allow us to carry page audits with tools like Lighthouse and find out more about our application - e.g. performance, SEO, accessibility etc.
Before we unpack each category further in part 2 of this series, let's take a quick tour of the Chrome devtools to understand where these core capabilities reside and familiarise yourself with the UI.
A quick tour of devtools
Right-click and inspect the Chrome devtools website.
What do you see?
You should see the following panels as shown in the image below:
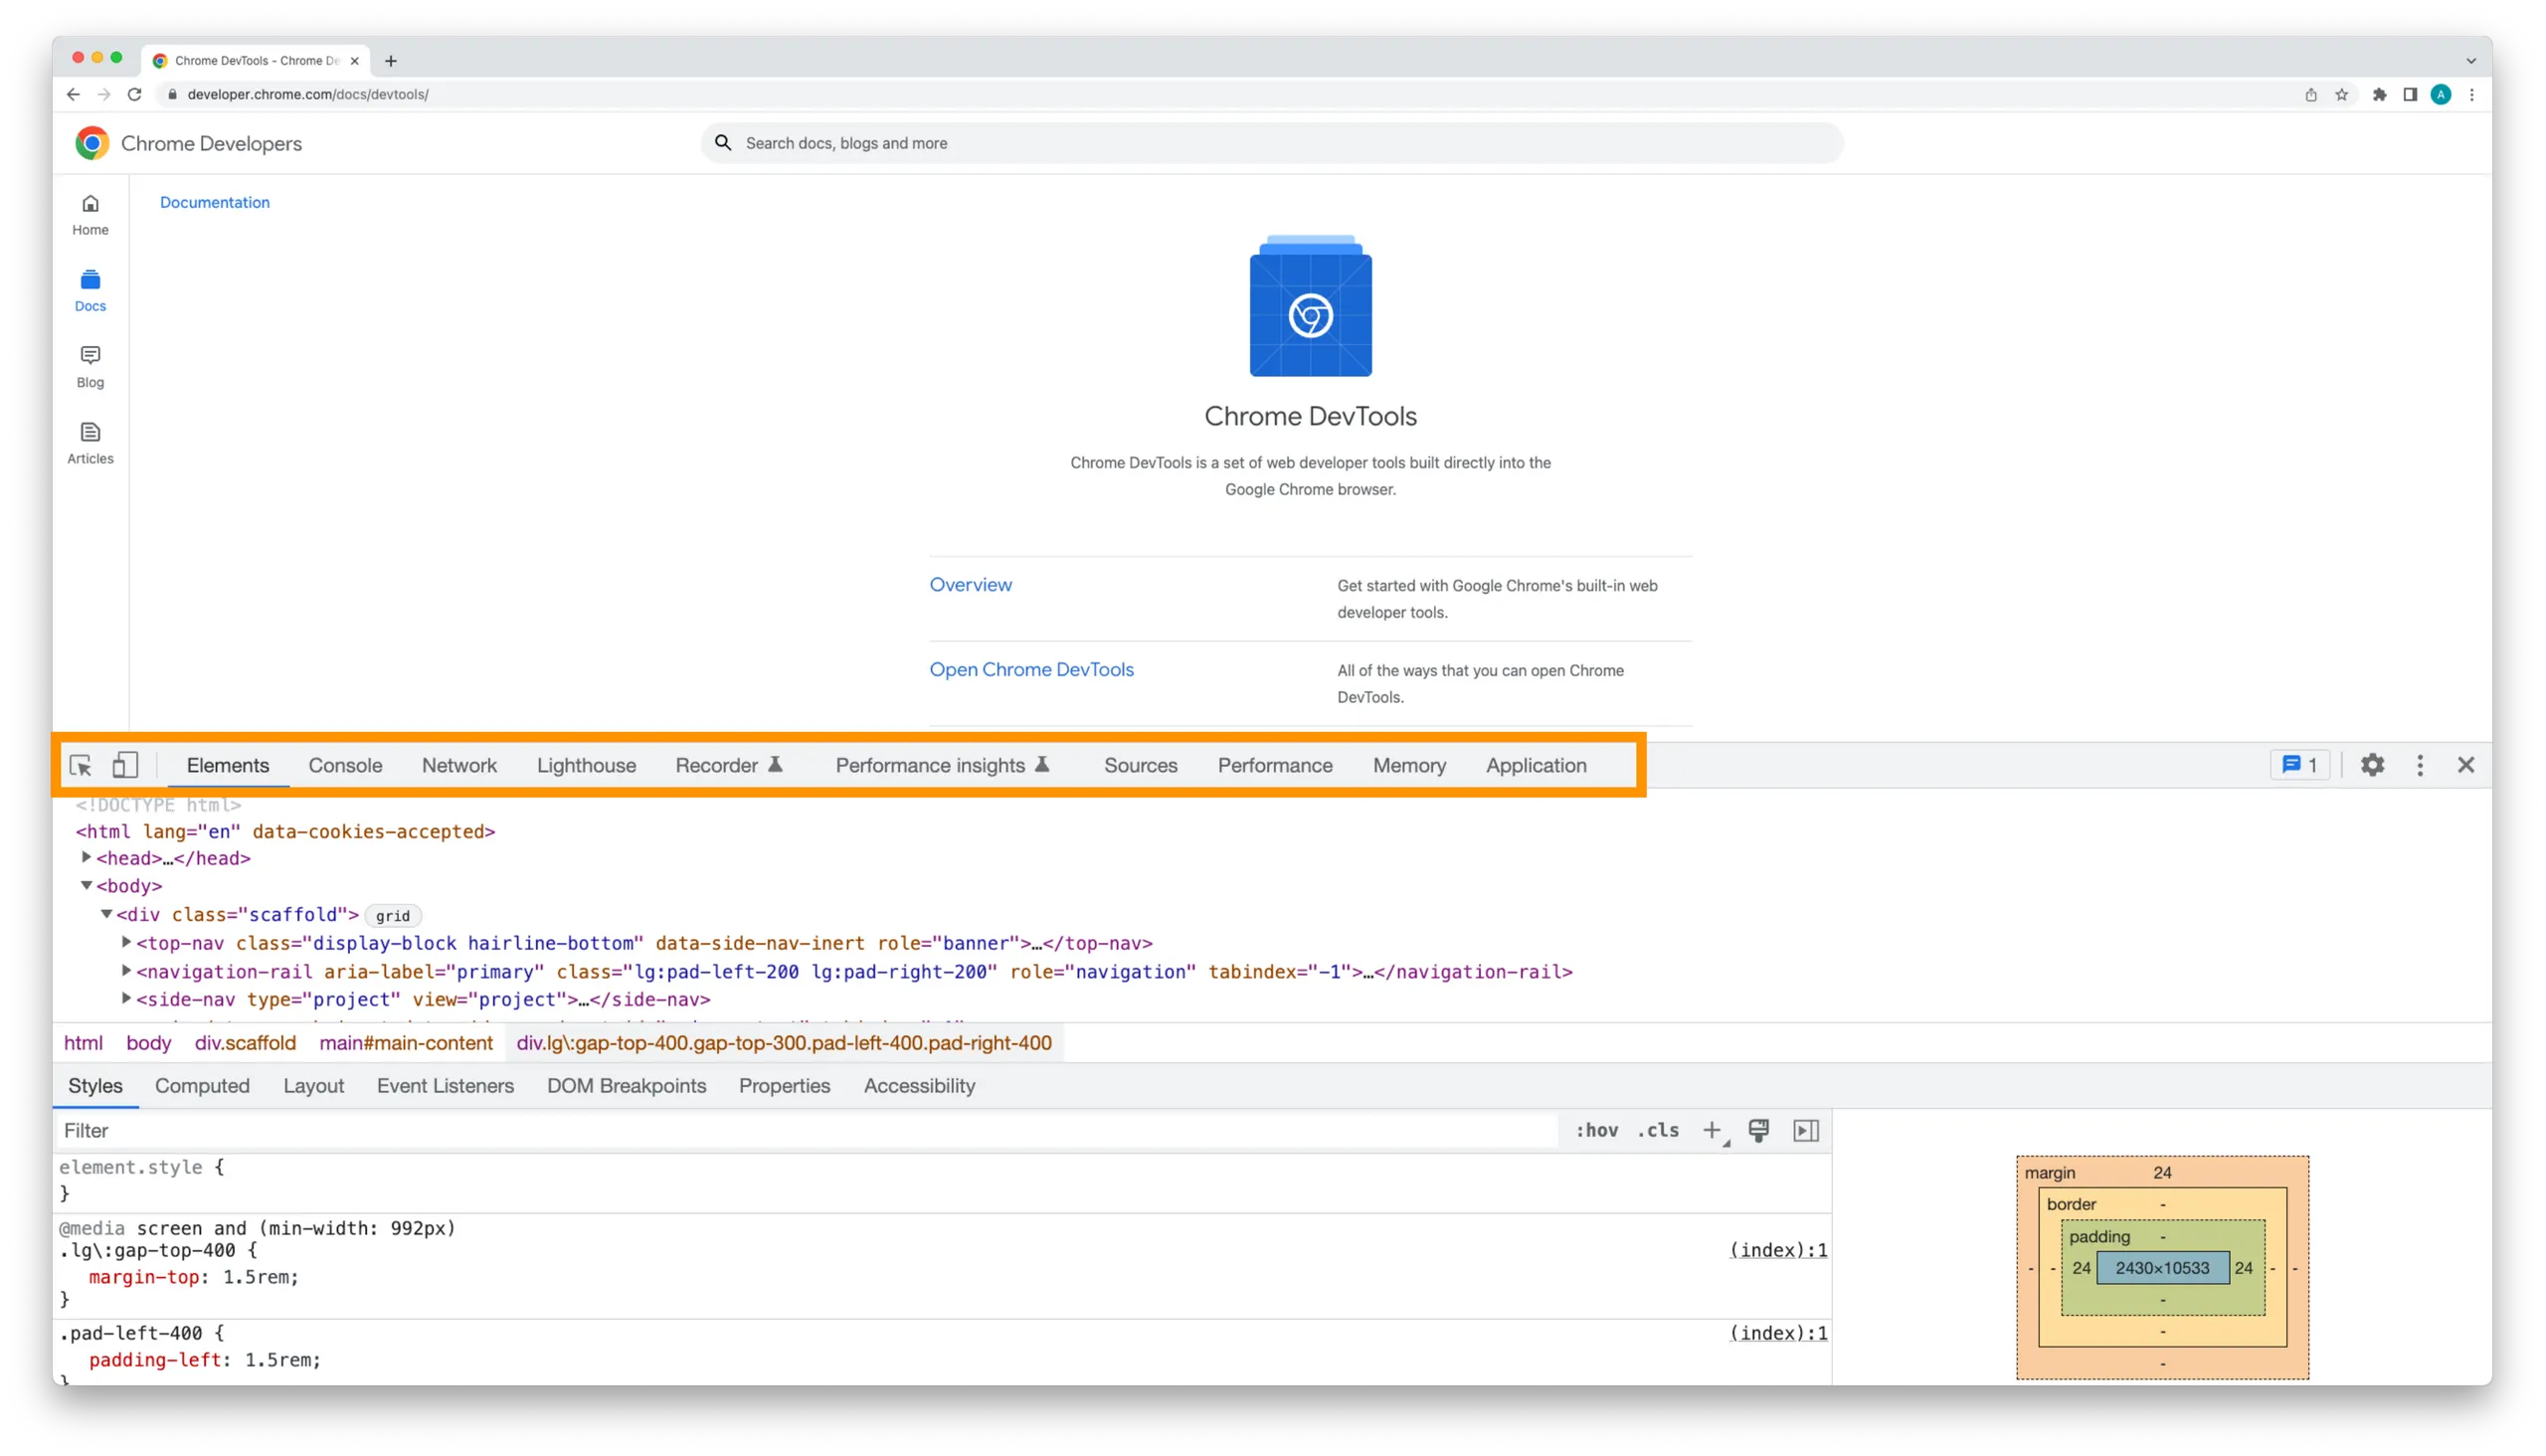

So what can we do in each panel?
Element - view and edit HTML and CSS.
Console - essentially a JS running environment. It also allows you to select an element from the elements tab and manipulate it with JS.
Network - presents a graphical representation of all the resource requests sent to build the page in view and further information related to the resource.
Performance - audit performance of the page and find potential causes of performance.
Memory - provides information concerning how memory is being used in an application.
Lighthouse - auditing tool that examines the overall health of a page and inspects performance, accessibility, SEO and more. Audit reports provide insight into opportunities to improve page experience.
Panels can be reordered in your preferred order simply by drag and drop.
More panels are available in the Chrome DevTools that haven't been mentioned above (e.g. Recorder, performance insights). It’s good to be aware of these, however they won’t be covered in the scope of this series as they are beyond the basics.
In the next instalment of this series, we'll look at some of the core functionalities of Chrome DevTools and how they can help us debug and better understand our app's state.
Devtools series